
Chapter 1. Private Equity Secondaries: A Distinct Asset Class
Private equity secondaries have evolved from a niche liquidity solution into one of the fastest-growing segments of the private capital markets. Unlike primary commitments, secondaries provide investors with exposure to existing private investment portfolios, greater visibility into underlying assets, and access to an increasingly mature institutional marketplace. Today, they represent more than a transaction mechanism—they constitute a distinct investment discipline that combines liquidity, valuation, and portfolio construction within the broader private markets ecosystem.

What Makes Secondaries Different?
Private equity secondaries differ from both primary private equity investments and public market securities in several fundamental ways.
They do not create new investments.
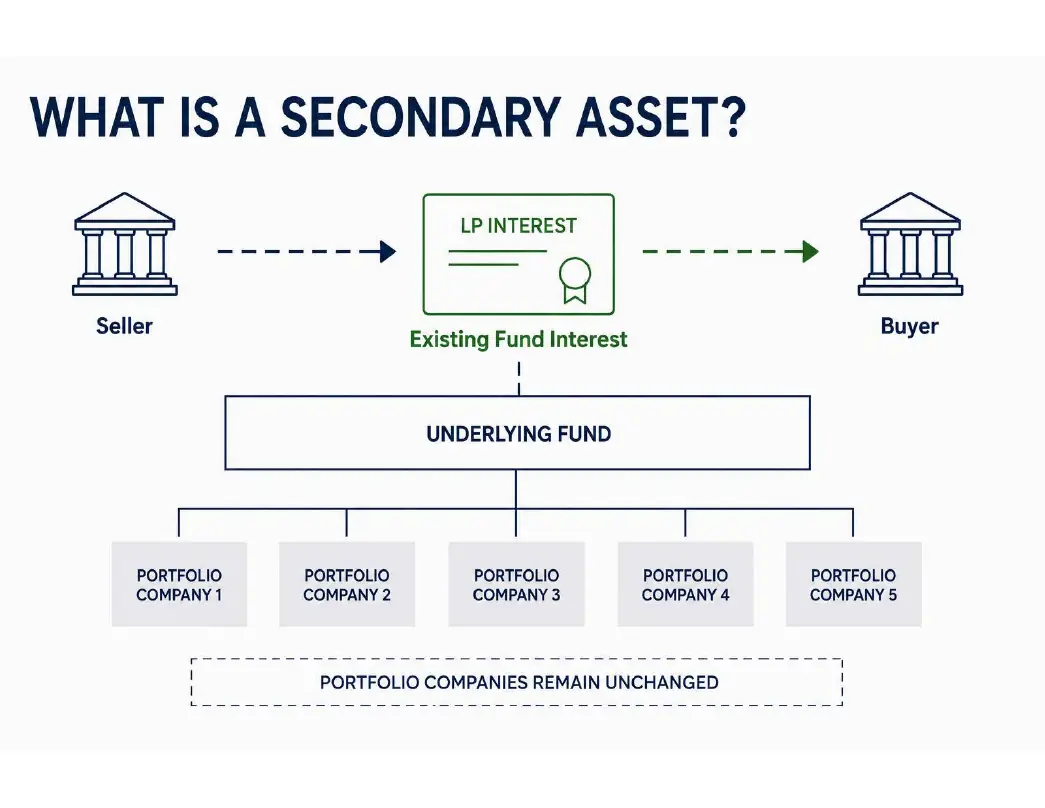
A secondary transaction transfers an existing ownership interest from one investor to another. The underlying companies, investment strategy, and fund manager remain unchanged.
They introduce liquidity into private markets.
Secondaries create a functioning marketplace for assets that were traditionally held until the end of a fund's lifecycle, giving investors greater flexibility in managing long-term private market allocations.
They provide greater investment visibility.
Unlike primary commitments, investors evaluate existing portfolios with known assets, historical operating performance, unrealized valuations, and expected future cash flows.
They have become an investable asset class.
The secondary market is no longer simply an exit mechanism. It has developed into a specialized investment strategy supported by dedicated managers, institutional capital, sophisticated valuation methodologies, and an increasingly efficient market infrastructure.
Primary Versus Secondary Investing
The distinction between primary and secondary investing extends beyond transaction timing.
Primary investors commit capital to newly established funds before underlying portfolio companies have been fully identified or acquired. Investment outcomes depend largely on the future investment decisions of the general partner over a multi-year investment period.
Secondary investors acquire ownership interests in funds that have already progressed through part of their lifecycle. Existing portfolio companies, historical operating performance, unrealized asset values, remaining capital commitments, and expected distributions can all be evaluated before making an investment decision.
This additional information fundamentally changes the underwriting process. Rather than committing capital to an unknown future portfolio, secondary investors assess an existing portfolio with measurable characteristics, providing greater transparency while maintaining exposure to the long-term value creation potential of private markets.
Key distinction: Secondary investing changes the information available to investors—not the underlying private assets.
What Constitutes a Secondary Asset?
A secondary asset represents an existing ownership interest in a private investment fund rather than direct ownership of an operating company.
Its value is determined by several interconnected factors:
- Quality of the underlying portfolio companies
- Remaining investment duration
- Expected future cash flows and distributions
- Experience and performance of the investment manager
- Prevailing market conditions and transaction pricing
Unlike publicly traded securities, secondary assets are valued through detailed due diligence, negotiated transactions, and analysis of expected future performance rather than continuous market quotations.
Why Secondaries Matter
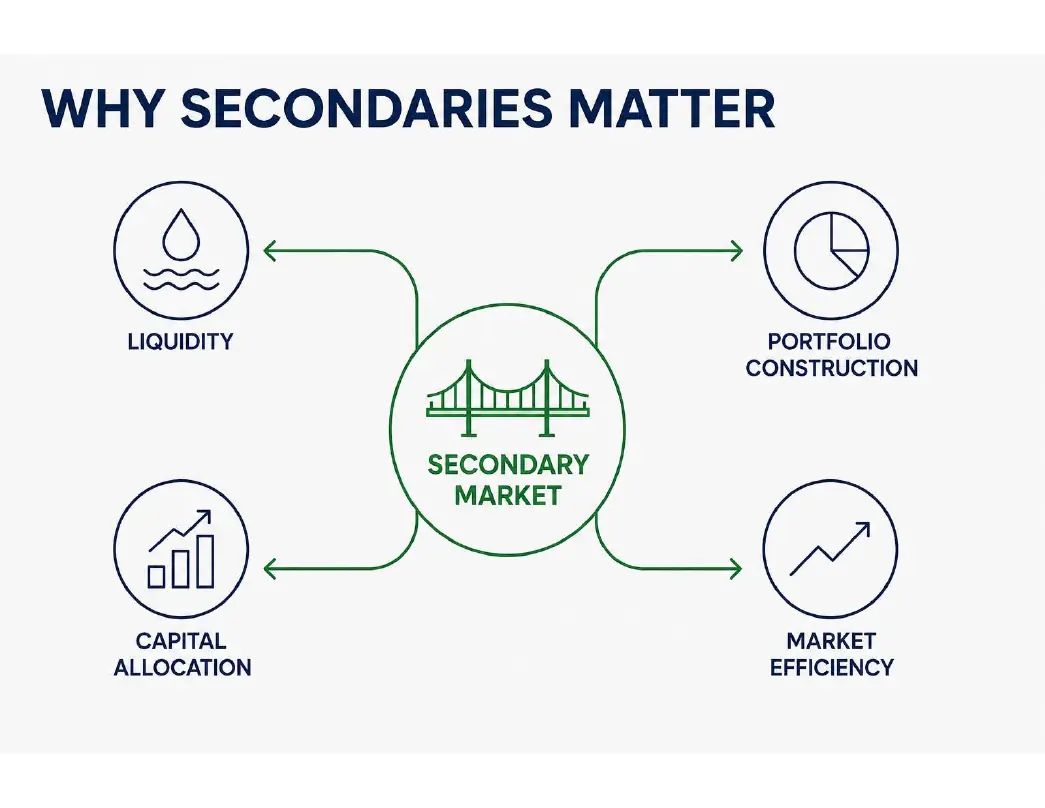
The emergence of an active secondary market has fundamentally changed the economics of private investing.
By introducing liquidity into historically illiquid markets, secondaries enable investors to actively manage private market exposures rather than simply holding investments until fund termination. This flexibility supports more efficient portfolio construction, improved capital allocation, and enhanced portfolio resilience.
At the same time, buyers gain access to seasoned private market portfolios with greater investment visibility, while sellers obtain a mechanism for portfolio rebalancing, liquidity management, and strategic repositioning. The result is a more efficient private capital ecosystem that benefits investors, fund managers, and the broader market alike.
Today, secondaries have become an essential component of institutional portfolio management, transforming private market investments from static long-term commitments into assets that can be actively incorporated into modern portfolio construction.
Key Research Findings
- Private equity secondaries have evolved into a distinct institutional asset class.
- Secondary transactions transfer existing ownership rather than creating new investments.
- The secondary market introduces liquidity into historically illiquid private assets.
- Investors benefit from greater visibility into underlying portfolios compared with primary commitments.
- Market maturity has expanded the role of secondaries beyond liquidity events into strategic portfolio management.
Portfolio Construction Implications
| Research Finding | Portfolio Implication |
|---|---|
| Existing investment portfolios | Greater underwriting transparency |
| Established cash-flow profile | Improved income and return forecasting |
| Secondary market liquidity | Increased portfolio flexibility |
| Institutional market infrastructure | Higher confidence in valuation and execution |
| Active marketplace | More efficient portfolio optimization and diversification |
Chapter 1 establishes the conceptual foundation for the remainder of this paper. The following chapter examines how the secondary market evolved from a niche liquidity solution into a mature institutional marketplace and how that evolution influences long-term investment assumptions, valuation efficiency, and portfolio construction.
Chapter 2. Evolution of the Secondary Market
The private equity secondary market has evolved from a niche liquidity mechanism into an essential component of institutional investing. What began as an opportunistic market for distressed fund interests has matured into a sophisticated ecosystem supporting portfolio management, capital allocation, valuation efficiency, and liquidity across virtually every segment of private markets.
Today, secondaries are no longer viewed as exceptions to private investing. They represent a permanent market infrastructure that enables investors to actively manage long-duration private assets while preserving the underlying investment strategy.
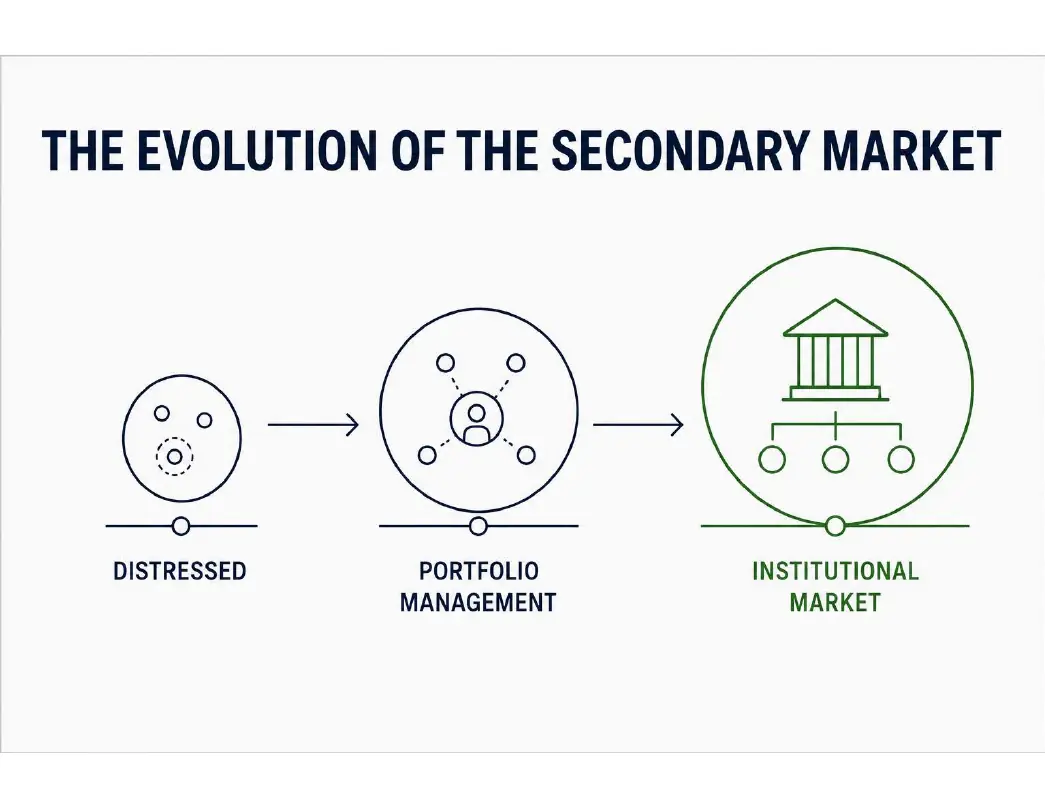
From Distressed Sales to Strategic Portfolio Management
The earliest secondary transactions were primarily driven by necessity. Investors sold fund interests to address liquidity needs, organizational restructuring, or financial distress, often at significant discounts.
As institutional allocations to private markets expanded, the purpose of secondary transactions changed. Rather than responding to financial pressure, investors increasingly used secondaries to rebalance portfolios, manage liquidity, adjust sector or geographic exposures, and optimize long-term allocations.
Today, secondary transactions are most commonly strategic portfolio management decisions rather than distressed sales.
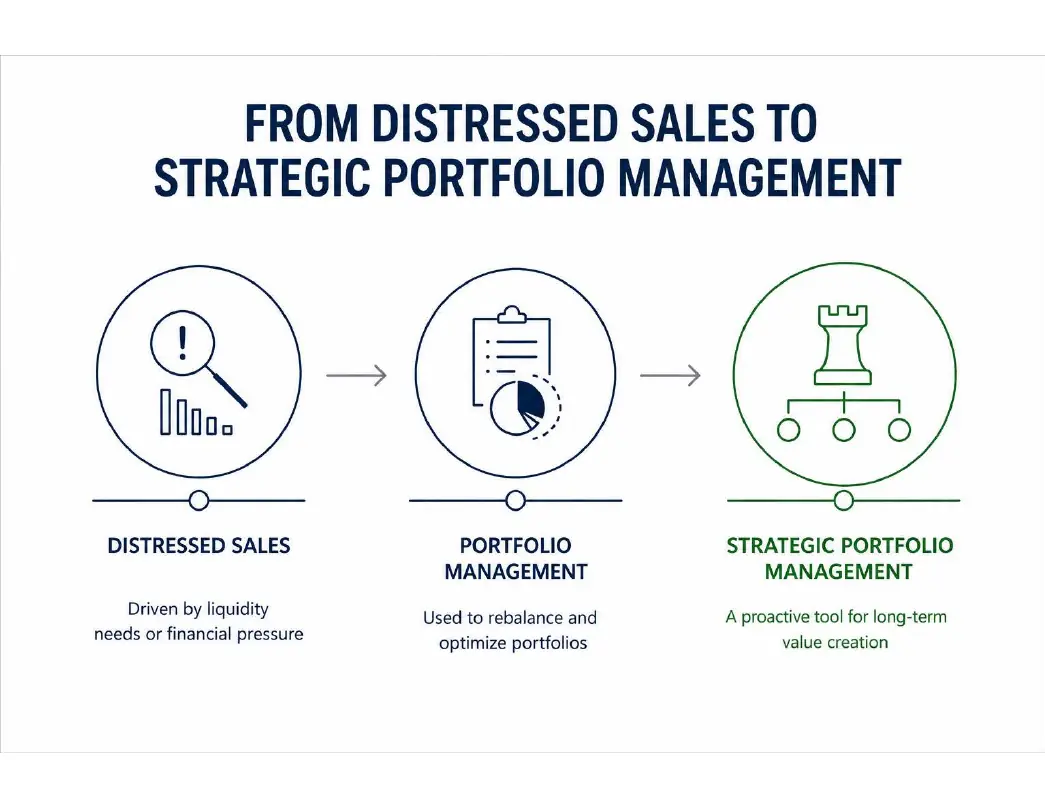
Key insight: The market has evolved from solving liquidity problems to enabling active portfolio management.
From Market Push to Mature Infrastructure
The rapid growth of private markets created demand for a more efficient transfer mechanism for private assets. In response, the secondary market developed into a specialized institutional ecosystem supported by dedicated investment managers, advisors, financing providers, valuation specialists, and increasingly standardized transaction processes.
As participation expanded, transparency improved, execution became more efficient, and pricing methodologies became more sophisticated.
The result is a mature market infrastructure capable of supporting transactions across virtually every major private asset class.

Key insight: Market growth created the institutional infrastructure that supports today's secondary market.
Liquidity as a Structural Feature
Private markets remain fundamentally long-term investments. However, they should no longer be viewed as completely illiquid.
The emergence of a mature secondary market has introduced conditional liquidity—the ability to transfer ownership through negotiated private transactions when portfolio objectives require it.
This additional layer of liquidity increases portfolio flexibility without changing the long-term investment characteristics of the underlying assets.

Key insight: Secondaries transform private markets from purely illiquid investments into conditionally liquid assets.
Expansion Beyond Traditional LP Transfers
Traditional LP interest transfers remain the foundation of the market, but transaction structures have expanded considerably.
Continuation funds, GP-led transactions, preferred equity, tender offers, and other structured solutions have broadened the role of secondaries beyond investor exits.
Today, secondaries are increasingly used to extend ownership of high-quality assets, restructure mature portfolios, and optimize capital allocation throughout the investment lifecycle.

Key insight: Secondaries have evolved from simple ownership transfers into flexible portfolio management solutions.
Competition and Pricing Efficiency
The growth of institutional participation has fundamentally improved market efficiency.
Dedicated secondary funds, institutional investors, and specialized buyers compete for high-quality assets, increasing the depth of the buyer universe and improving valuation confidence.
Greater competition enhances price discovery, resulting in more efficient pricing for assets that historically traded infrequently or remained effectively illiquid.

Key insight: Competition creates better price discovery and improves valuation efficiency across private markets.
Long-Term Growth Drivers
Several structural trends support continued expansion of the secondary market.
Private companies continue to remain private for longer periods, extending investment holding horizons and increasing demand for liquidity solutions before traditional fund termination.
Institutional investors continue expanding private market allocations while adopting increasingly active portfolio management practices. At the same time, GP-led transactions and continuation funds continue broadening the range of secondary opportunities available to investors.
These trends reinforce one another. As private markets grow, demand for secondary liquidity grows alongside them, creating a self-reinforcing cycle of market expansion and institutional adoption.

Key insight: The continued growth of private markets creates structural demand for secondary market liquidity.
Key Research Findings
- The secondary market has evolved from distressed transactions to strategic portfolio management.
- Institutional participation has transformed secondaries into a mature market infrastructure.
- Conditional liquidity has become a defining structural characteristic of modern private markets.
- GP-led transactions and continuation funds continue expanding the secondary market beyond traditional LP transfers.
- Increased competition improves price discovery and valuation efficiency.
- Long-term private market growth supports continued expansion of secondary market activity.
Portfolio Construction Implications
| Research Finding | Portfolio Modeling Implication |
|---|---|
| Institutional market maturity | Higher confidence in valuation assumptions |
| Conditional liquidity | Lower structural liquidity risk than traditional private investments |
| More efficient price discovery | Improved valuation reliability and market comparables |
| Growing secondary capital | Greater transaction certainty and market depth |
| Expansion of GP-led structures | Broader investment opportunity set |
| Longer private company lifecycles | Sustained long-term demand for secondary liquidity |
Chapter 2 establishes the structural foundation of the secondary market. These long-term characteristics provide the basis for the valuation methodologies, risk assumptions, cash flow modeling, and portfolio construction framework developed in the following chapters.
Chapter 3. Sources of Return in Private Equity Secondaries
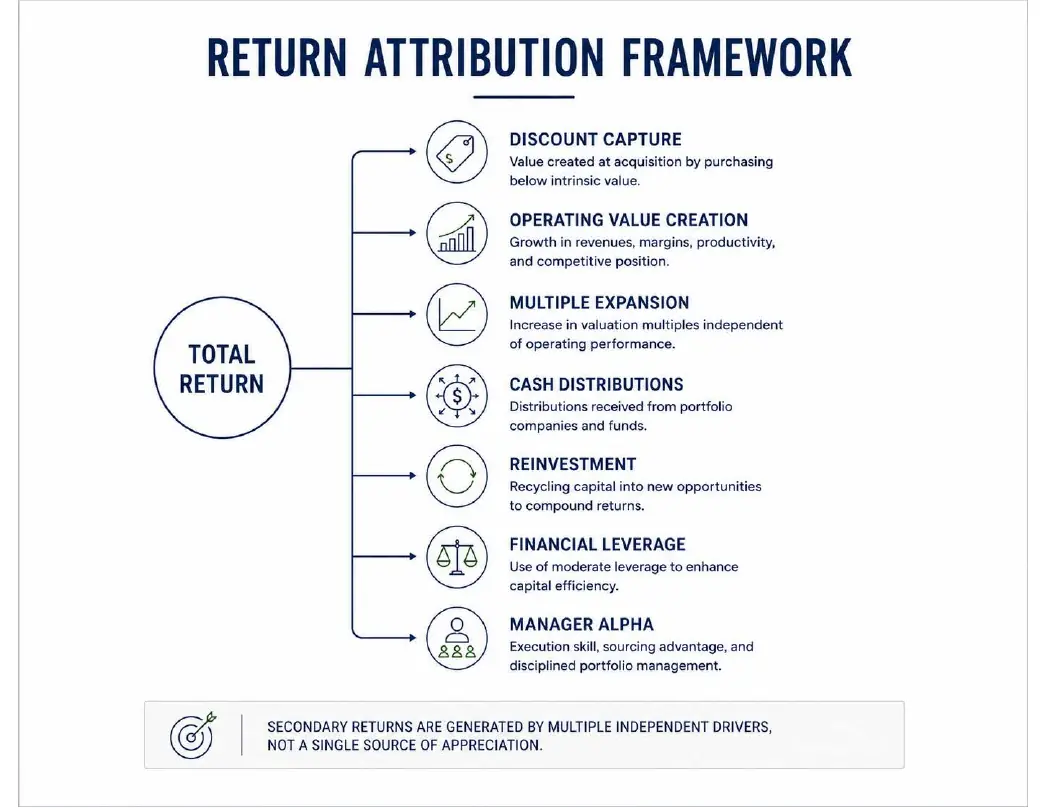
Discount Capture
Discount capture is the return source unique to secondary investing. Purchasing an existing private market interest below intrinsic value creates an immediate valuation advantage that may be realized over the remaining holding period. The opportunity is typically greatest during periods of market dislocation when liquidity demand temporarily exceeds available capital.
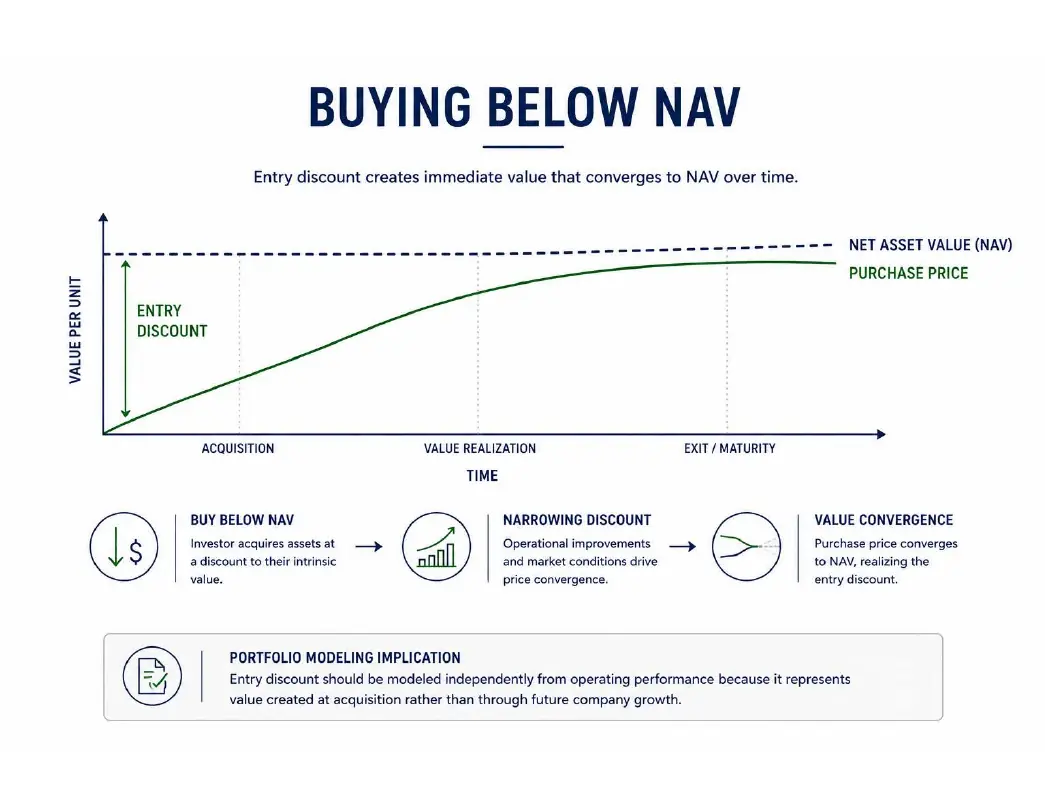
(Illustration showing NAV vs. purchase price converging over time.)
Portfolio modeling implication
Entry discount should be modeled independently from operating performance because it represents value created at acquisition rather than through future company growth.
Operating Value Creation
The largest contributor to long-term returns remains the operational improvement of the underlying portfolio companies. Revenue growth, margin expansion, acquisitions, deleveraging, and operational execution continue regardless of whether the investment was acquired through the primary or secondary market.
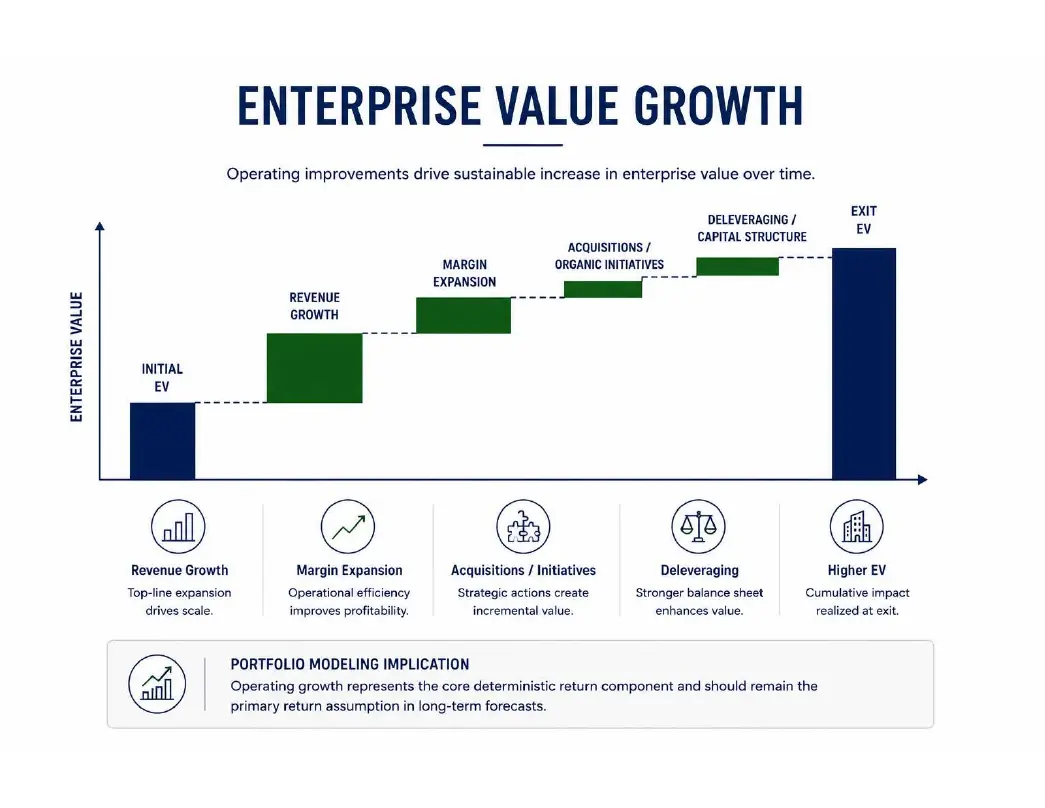
(Simple enterprise value curve decomposed into operating growth.)
Portfolio modeling implication
Operating growth represents the core deterministic return component and should remain the primary return assumption in long-term forecasts.
Multiple Expansion
Changes in valuation multiples create an additional return layer independent of operating performance. Expanding exit multiples enhance realized returns, while multiple compression can offset otherwise strong company growth.
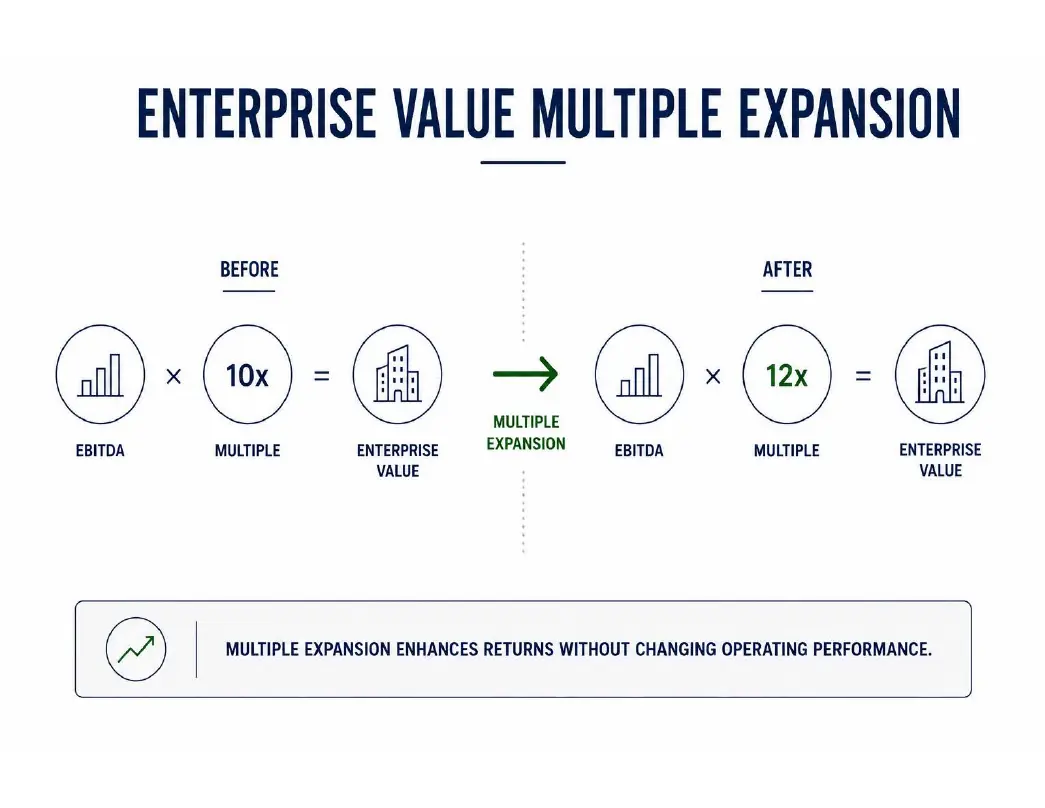
(Illustration of EBITDA remaining constant while valuation multiple expands.)
Portfolio modeling implication
Multiple expansion should be treated as a scenario-dependent macroeconomic assumption rather than a structural return driver.
Cash Distributions and Reinvestment
Unlike primary funds, secondary portfolios often enter the distribution phase shortly after acquisition. Earlier distributions shorten portfolio duration while creating opportunities to reinvest capital into additional private or public market investments.
The return generated from reinvestment becomes an additional compounding mechanism that is frequently overlooked in traditional performance analysis.

(Cash distributions flowing back into new investments.)
Portfolio modeling implication
Distribution timing and reinvestment assumptions should be modeled explicitly because they materially influence long-term wealth accumulation.
Financial Leverage
Some secondary transactions employ moderate leverage to improve capital efficiency. While leverage can increase returns, it also amplifies sensitivity to financing costs and market volatility.
Its contribution varies considerably across managers and transaction structures.
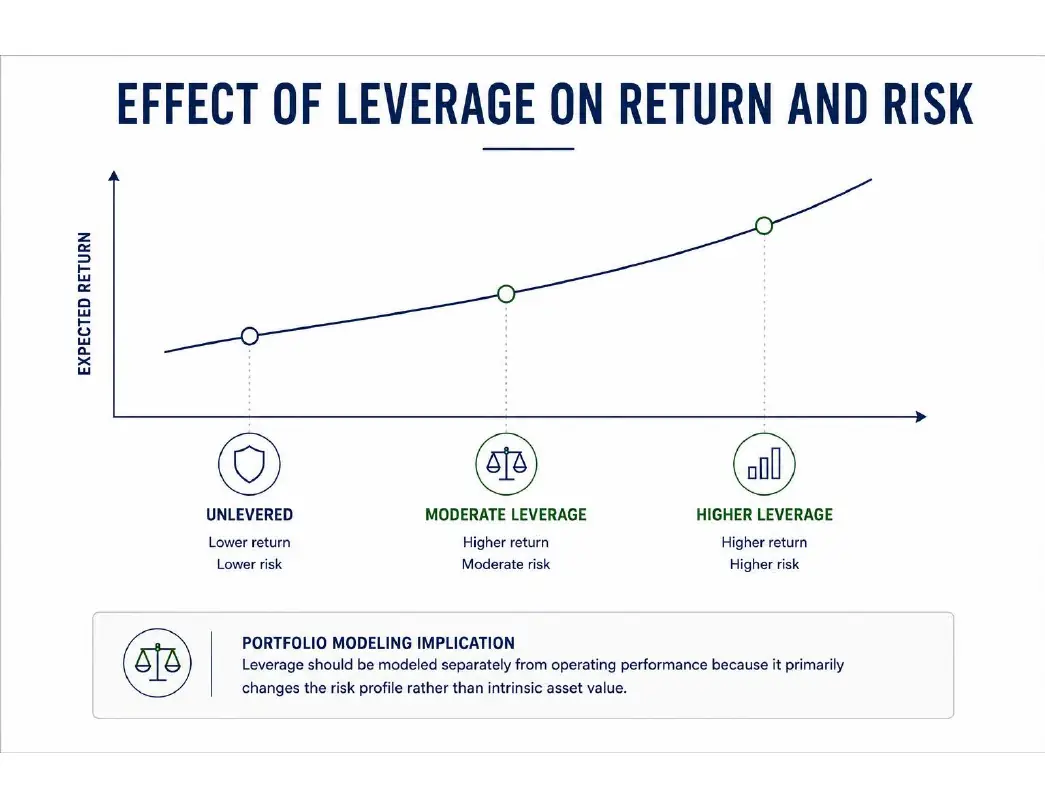
(Simple risk-return spectrum.)
Portfolio modeling implication
Leverage should be modeled separately from operating performance because it primarily changes the risk profile rather than intrinsic asset value.
Manager Alpha
As pricing becomes increasingly efficient, manager selection becomes a larger determinant of long-term performance.
Superior managers differentiate themselves through sourcing proprietary transactions, underwriting discipline, pricing, portfolio construction, and exit execution.
Persistent dispersion among leading secondary managers demonstrates that execution quality remains a meaningful contributor to excess returns.
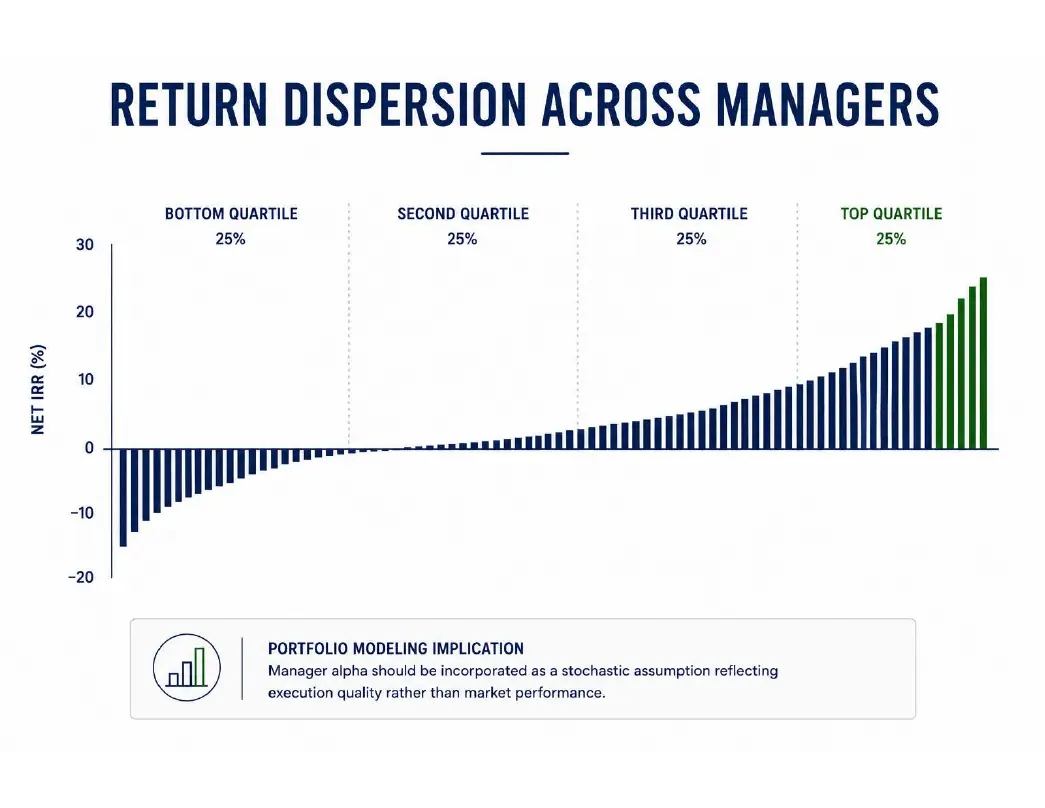
(Quartile performance or dispersion chart.)
Portfolio modeling implication
Manager alpha should be incorporated as a stochastic assumption reflecting execution quality rather than market performance.
Relative Importance of Return Drivers
| Return Driver | Relative Contribution | Predictability | Sensitivity to Market Conditions |
|---|---|---|---|
| Operating Value Creation | Very High | High | Medium |
| Discount Capture | High | Medium | High |
| Cash Distributions | Medium | High | Low |
| Reinvestment | Medium | Medium | Medium |
| Manager Alpha | Medium | Medium | Medium |
| Multiple Expansion | Medium | Low | Very High |
| Financial Leverage | Low–Medium | Medium | High |
Key Research Findings
- Secondary returns are generated by multiple independent return drivers rather than a single appreciation mechanism.
- Operating value creation remains the dominant long-term source of performance.
- Discount capture is unique to secondaries and creates value at acquisition.
- Earlier distributions shorten effective investment duration while enabling reinvestment.
- Manager selection remains one of the strongest differentiators in realized returns.
- Market conditions primarily affect multiple expansion and discount capture rather than operating growth.
Portfolio Construction Implications
| Research Finding | Modeling Implication |
|---|---|
| Entry discounts | Model independently from operating returns |
| Operating growth | Primary deterministic return driver |
| Distribution timing | Explicit cash-flow modeling required |
| Reinvestment | Model portfolio-level compounding separately |
| Multiple expansion | Scenario-based macro assumption |
| Leverage | Separate risk amplifier |
| Manager alpha | Stochastic manager-specific assumption |
Chapter 4. Cash Flow Mechanics
Modeling the Economic Lifecycle of Secondary Investments
Chapter Introduction
Unlike primary private equity, secondary investments acquire interests in portfolios that have already progressed through a portion of their investment lifecycle. This structural distinction fundamentally alters the timing of capital deployment, the pace of value creation, the profile of cash distributions, and the duration of invested capital. For institutional investors, these characteristics are among the primary determinants of liquidity management, portfolio construction, and expected return.
This chapter examines the complete economic lifecycle of a secondary investment—from the initial capital commitment through capital deployment, net asset value evolution, distributions, and ultimate realization. Each stage is analyzed quantitatively and translated into practical assumptions suitable for portfolio modeling, stress testing, and Monte Carlo simulation. Rather than presenting qualitative descriptions, the objective is to establish a data-driven framework that captures the observable behavior of mature secondary portfolios and converts those observations into measurable investment parameters.
4.1 Cash Flow Lifecycle
Secondary investments follow a predictable sequence of economic events that differs materially from that of traditional private equity funds. Because assets are acquired after the original investment period has already begun, the lifecycle is compressed, resulting in accelerated capital deployment, earlier distributions, reduced duration, and a shorter path to portfolio realization. Understanding this lifecycle provides the foundation for analyzing each individual cash flow component examined throughout the remainder of this chapter.
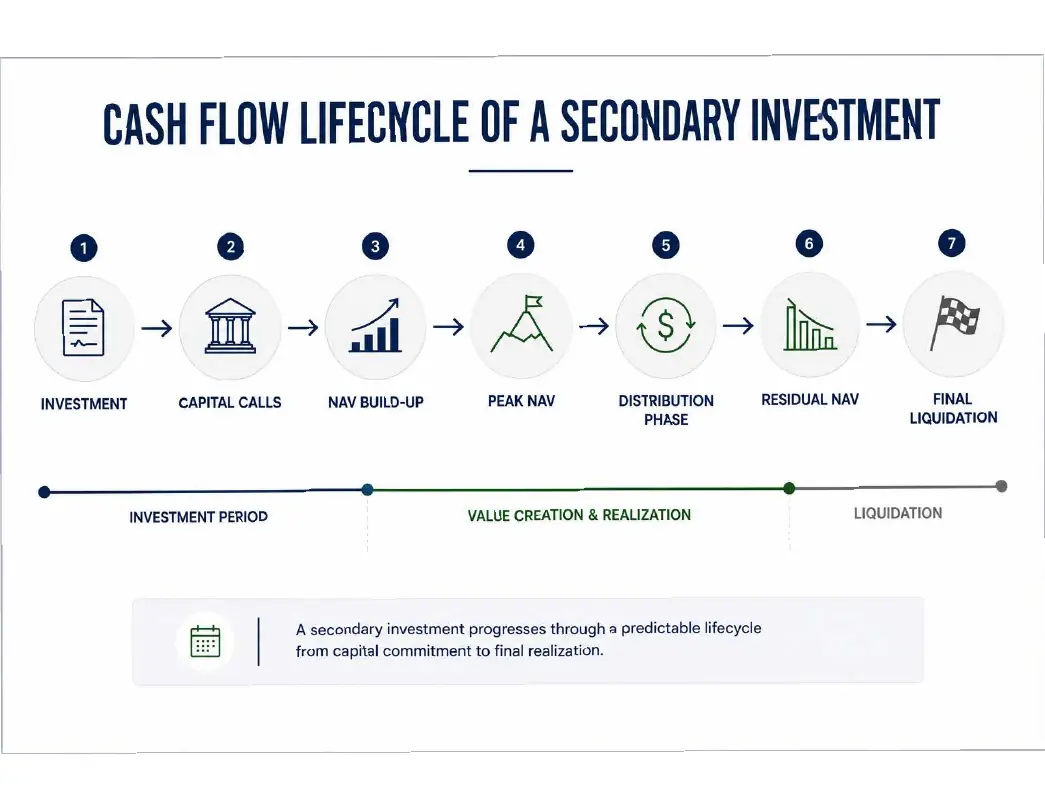
The lifecycle begins with capital commitments and subsequent capital calls, followed by rapid deployment into seasoned portfolio companies. As underlying businesses continue to mature, net asset value typically reaches its peak before gradually declining as investments are realized and distributions are returned to investors. Remaining portfolio value decreases over time until the fund reaches full liquidation. Although individual funds differ in timing, this general progression is remarkably consistent across mature secondary portfolios and forms the basis for quantitative cash flow forecasting.
Modeling Implications
The cash flow lifecycle establishes the chronological framework used throughout the portfolio modeling process. Each subsequent section of this chapter isolates one stage of the lifecycle and translates its observed characteristics into explicit modeling assumptions governing capital deployment, valuation dynamics, liquidity, and cash flow generation.
4.2 Expected Capital Deployment Profile
The speed with which committed capital is invested has a direct influence on portfolio efficiency, cash drag, and the timing of return generation. Unlike primary private equity funds, which often require several years to identify and execute new investments, secondary funds acquire portfolios that are already substantially invested. Consequently, capital deployment is generally completed over a much shorter period, reducing the amount of uninvested cash while accelerating participation in portfolio value creation.
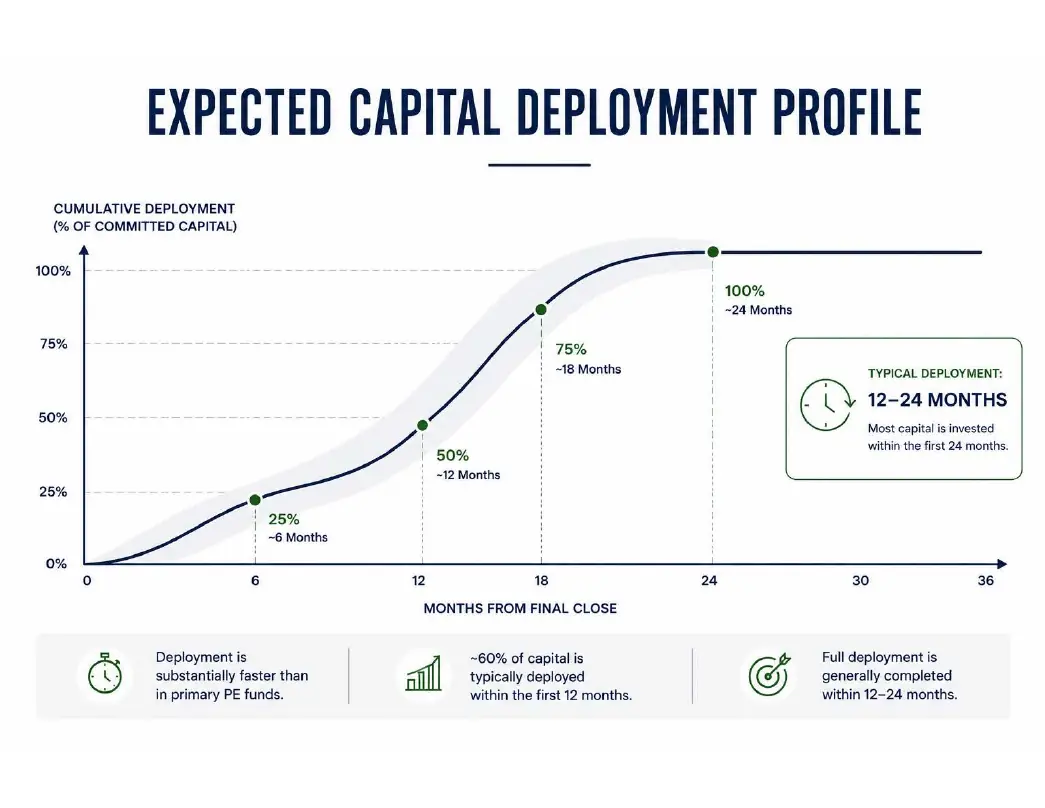
Empirical observations across institutional secondary funds indicate that most capital is deployed within approximately 12 to 24 months, with a significant portion invested during the first year following commitment. The resulting deployment curve is substantially steeper than that observed in traditional buyout funds and exhibits considerably lower dispersion between vintages. Faster deployment reduces opportunity cost associated with idle capital while increasing predictability of cash flow timing, an important consideration for institutional liquidity management.
Modeling Implications
For portfolio simulation, capital deployment should be modeled as a cumulative deployment curve rather than a single investment event. Parameters governing deployment duration, deployment variability, and residual commitments directly influence cash drag, expected return generation, and early portfolio behavior during Monte Carlo simulation.
4.3 Capital Call Profile
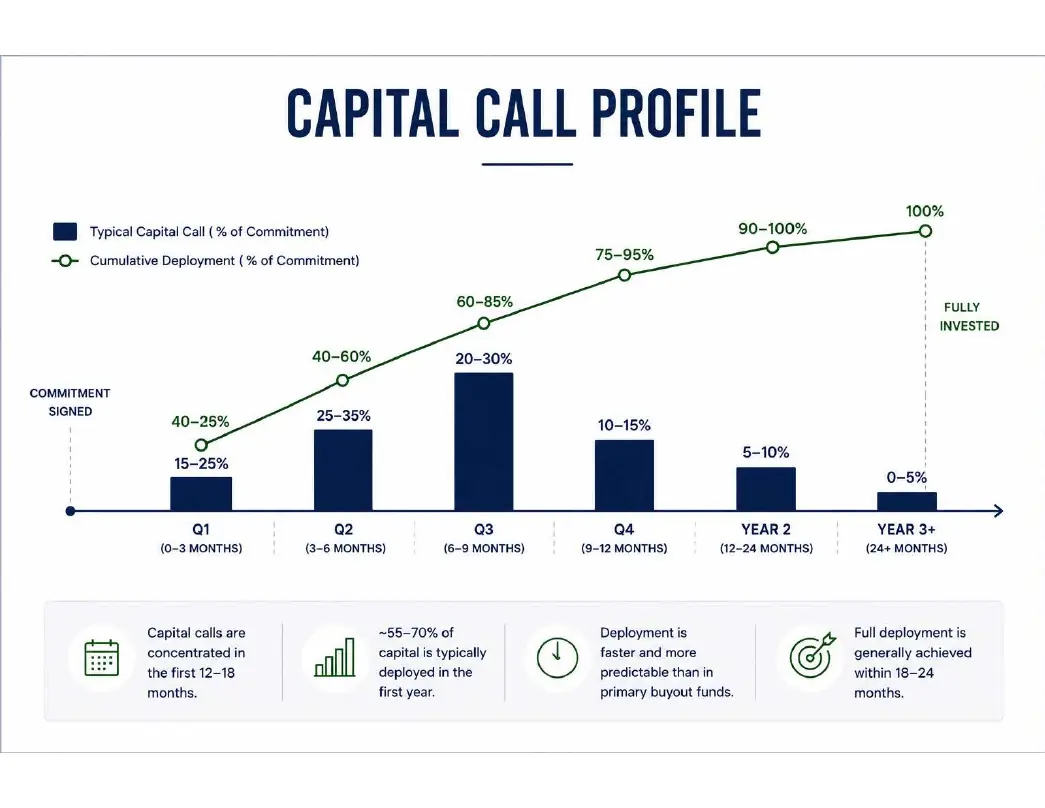
Capital commitments are not invested immediately but are drawn over time through a series of capital calls. The timing and magnitude of these calls determine the pace at which investors transition from committed to invested capital and directly influence liquidity planning. Compared with primary private equity funds, secondary vehicles typically exhibit a more concentrated and predictable capital call profile because the underlying assets have already been identified and acquisition opportunities are immediately available.
Analysis
Capital calls within secondary funds are generally concentrated during the first two years following commitment, with the majority of committed capital invested during the first twelve to eighteen months. This accelerated deployment reduces the duration of uninvested capital while improving cash flow predictability for investors. Although individual transactions may vary, secondary funds typically require fewer capital calls and exhibit lower variability than comparable primary buyout funds, simplifying liquidity management and reducing commitment uncertainty.
Modeling Implications
Capital calls should be modeled as a time-dependent cash outflow rather than a single investment event. Quarterly call frequency, cumulative deployment, and timing dispersion directly influence cash drag, liquidity requirements, and early-stage portfolio performance within Monte Carlo simulations.
4.4 NAV Evolution
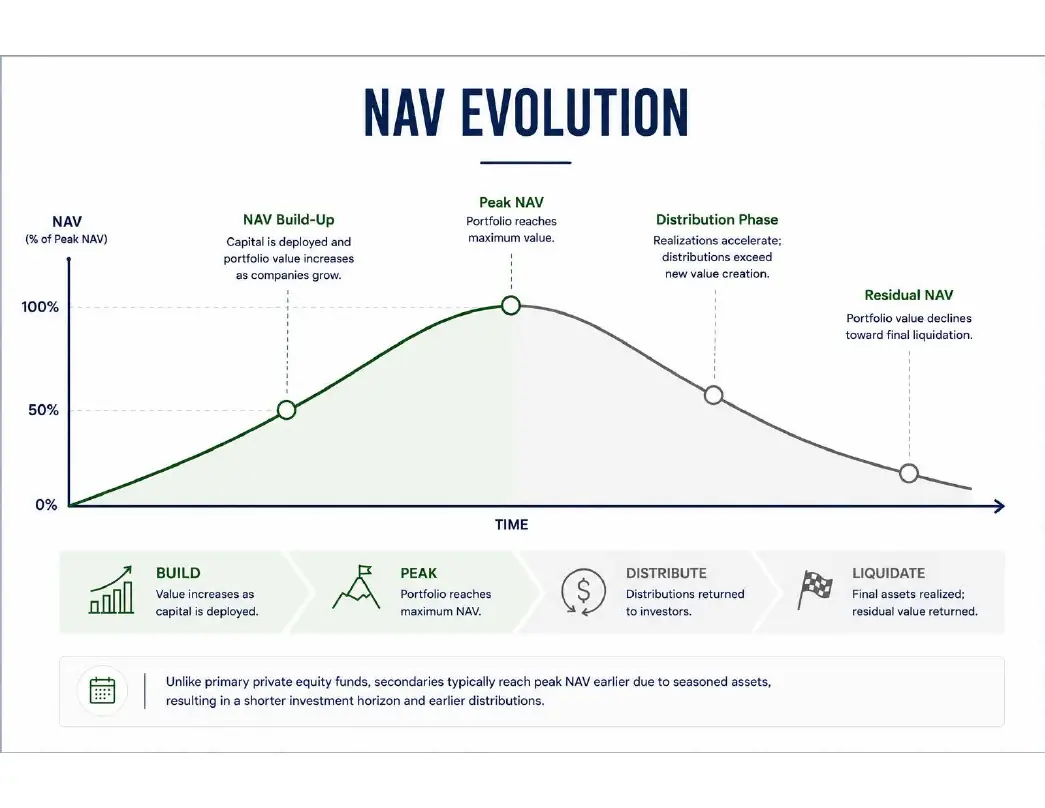
Following capital deployment, portfolio value evolves as underlying companies continue to execute their business plans, generate operating growth, and ultimately realize investments through exits. The resulting pattern of net asset value (NAV) reflects the economic progression of the portfolio, beginning with asset accumulation, reaching a period of maximum invested value, and gradually declining as distributions return capital to investors.
Analysis
Unlike primary private equity funds, secondary portfolios typically reach peak net asset value earlier because the acquired assets have already progressed beyond their initial investment stage. Following this peak, realizations increasingly offset remaining unrealized value, producing a gradual decline in portfolio NAV as distributions accelerate. This predictable progression provides a useful framework for estimating remaining portfolio value, expected distributions, and the residual investment horizon throughout the life of the fund.
Modeling Implications
The evolution of NAV provides the foundation for estimating portfolio valuation through time. Peak NAV timing, NAV decay, residual value, and realization rates should be incorporated as explicit state variables governing portfolio valuation, expected distributions, and remaining investment duration.
4.5 Distribution Profile
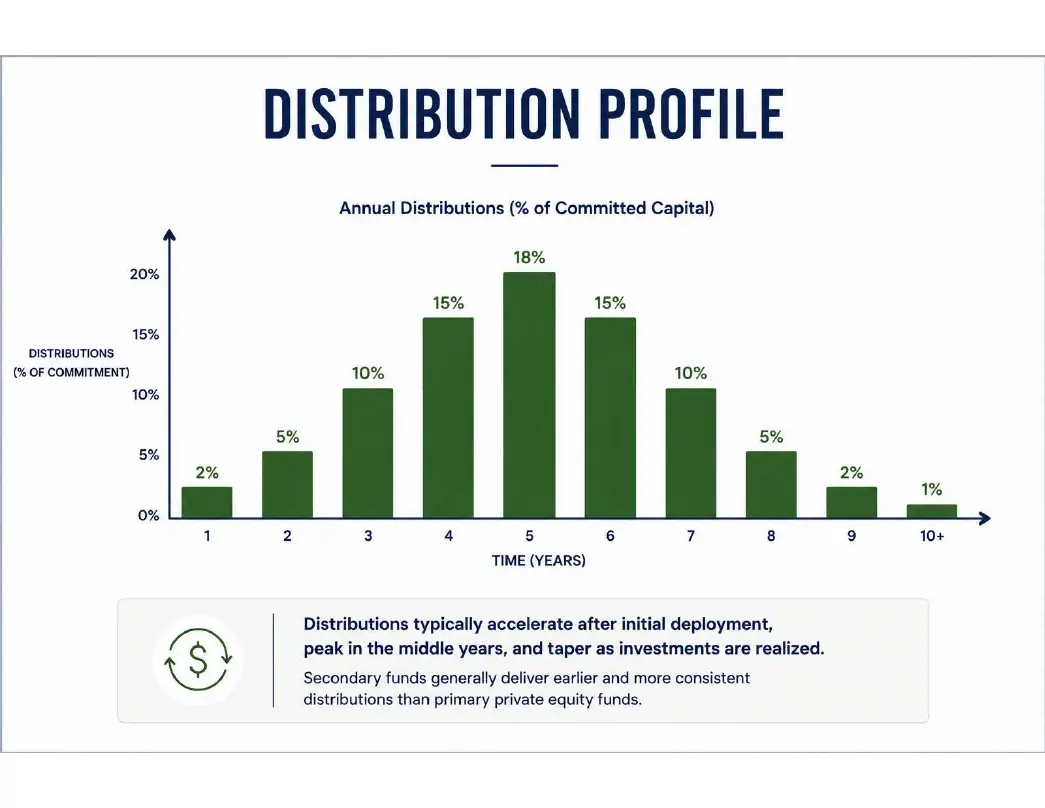
As portfolio companies mature and investments are realized, cash is progressively distributed to investors through dividends, recapitalizations, and asset sales. Compared with primary private equity funds, secondary portfolios generally begin generating distributions earlier because the acquired assets have already progressed through a portion of their investment lifecycle. The timing and consistency of these distributions are central to liquidity forecasting and portfolio cash flow modeling.
Analysis
Distribution activity typically accelerates after the initial deployment period, reaching its highest levels during the middle years of the fund before gradually declining as remaining investments are realized. Earlier and more consistent cash distributions distinguish secondary funds from primary buyout vehicles, reducing portfolio duration while increasing the availability of capital for reinvestment. Although realization timing varies across market environments, mature secondary portfolios generally exhibit greater distribution predictability than primary private equity strategies.
Modeling Implications
Annual distribution yield, distribution timing, persistence, and variability should be modeled explicitly to estimate portfolio cash generation, reinvestment opportunities, and long-term compounding within stochastic portfolio simulations.
4.6 Remaining NAV Profile
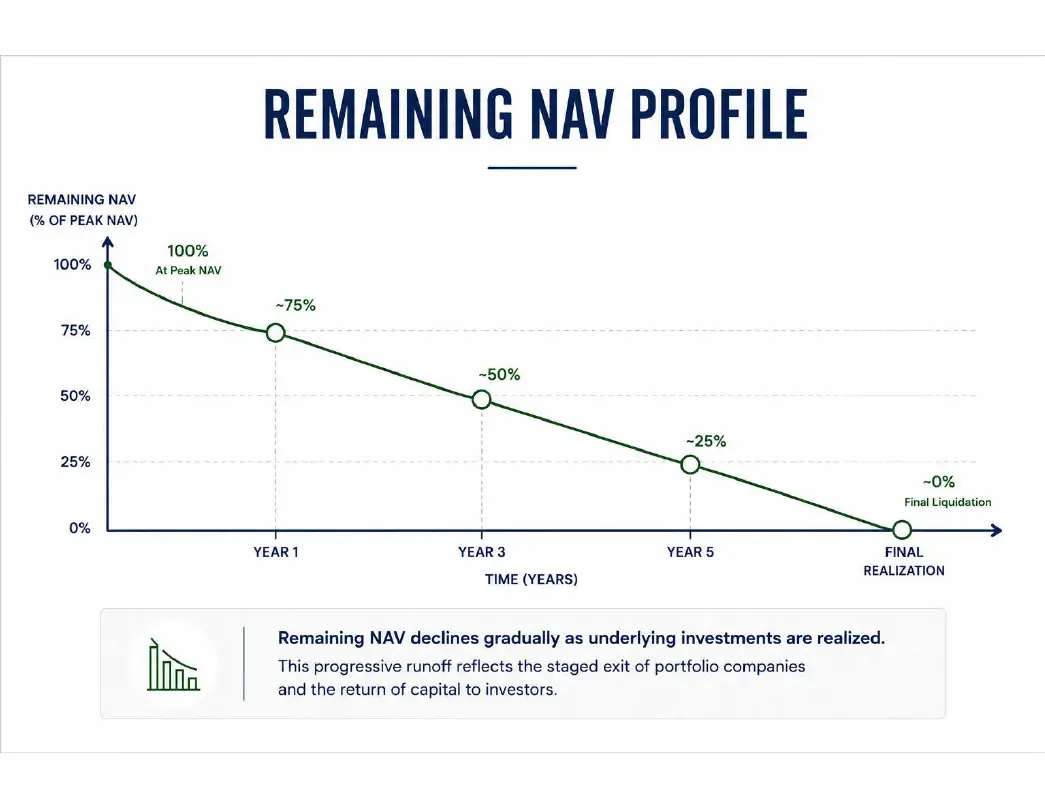
While cash distributions steadily return capital to investors, a portion of portfolio value remains invested until the final assets are realized. The remaining net asset value (NAV) represents the unrealized component of the portfolio and serves as an important indicator of future appreciation potential, expected distributions, and residual investment risk throughout the fund's lifecycle.
Analysis
Remaining NAV generally declines gradually rather than abruptly as underlying investments are exited over multiple years. This progressive runoff reflects the staged realization of portfolio companies and provides a useful measure of the portfolio's remaining economic life. Monitoring residual NAV enables investors to estimate future liquidity, remaining exposure to private markets, and the proportion of unrealized value still contributing to expected portfolio returns.
Modeling Implications
Remaining NAV should be modeled as a declining state variable linked to realization activity. NAV runoff, residual value, and expected exit timing provide the basis for estimating future distributions, portfolio duration, and remaining investment exposure.
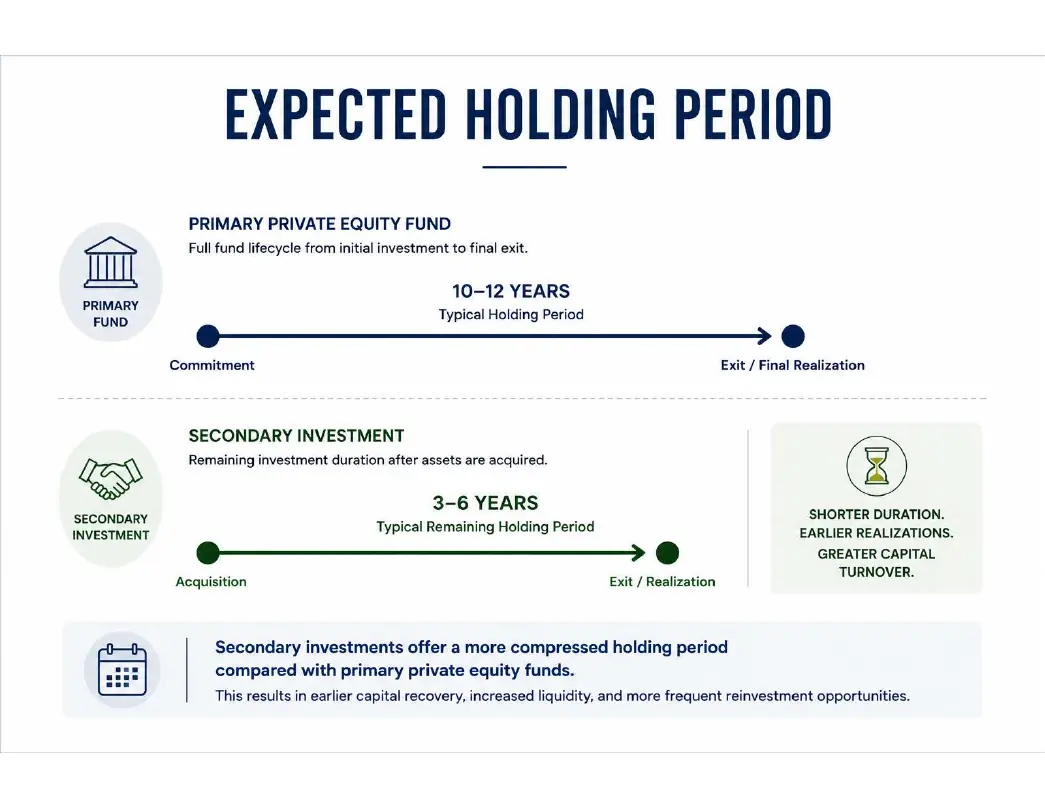
4.7 Expected Holding Period
The holding period of a secondary investment reflects the remaining economic life of the acquired portfolio rather than the full duration of the underlying private equity fund. Because secondary transactions acquire interests in already-seasoned assets, investors typically experience a shorter investment horizon, earlier realizations, and a reduced exposure period compared with traditional primary commitments. This accelerated lifecycle improves capital turnover while increasing the frequency of portfolio reinvestment.
Analysis
The effective holding period of secondary investments is generally shorter than that of primary private equity funds because a portion of the value creation process has already occurred prior to acquisition. Earlier exits shorten portfolio duration, improve liquidity planning, and reduce the time required for capital recovery. Although holding periods vary across strategies and market conditions, secondary funds consistently demonstrate a more compressed investment lifecycle than comparable primary vehicles.
Modeling Implications
Expected holding period should be modeled as the remaining investment duration rather than the original fund life. Exit timing, realization schedules, and duration assumptions directly influence portfolio turnover, capital recycling, and long-term return projections.
4.8 Cash Flow Volatility
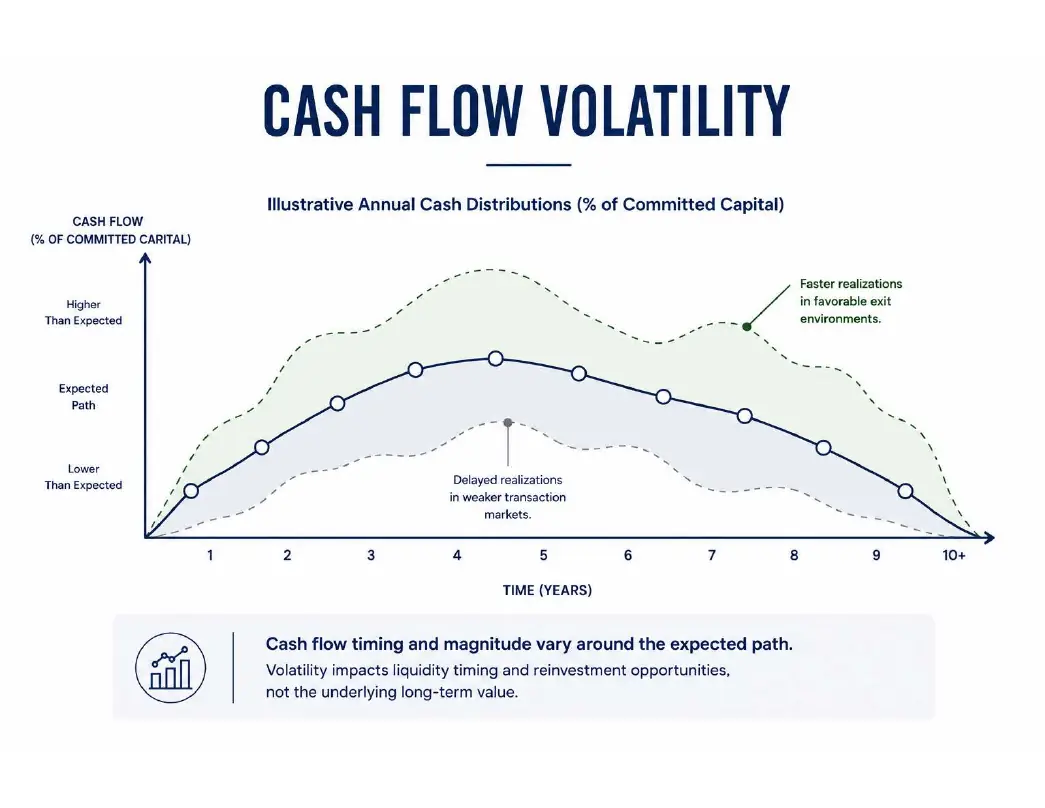
Although private equity cash flows are generally less frequent than those of publicly traded securities, their timing remains inherently uncertain because realizations depend upon company exits, refinancing activity, and market conditions. Understanding this variability is essential for estimating liquidity requirements, reinvestment opportunities, and portfolio resilience under different economic scenarios.
Analysis
Cash flow volatility reflects fluctuations in both the timing and magnitude of capital distributions rather than changes in reported portfolio value. Favorable exit environments may accelerate distributions, while weaker transaction markets often delay realizations without permanently impairing long-term portfolio value. As a result, cash flow variability primarily influences liquidity management and reinvestment timing rather than the underlying economics of the investment itself.
Modeling Implications
Cash flow volatility should be incorporated through stochastic distribution timing, distribution variability, and market-dependent realization assumptions. These parameters govern liquidity forecasting, reinvestment opportunities, and scenario-based portfolio stress testing.
4.9 Distribution Persistence
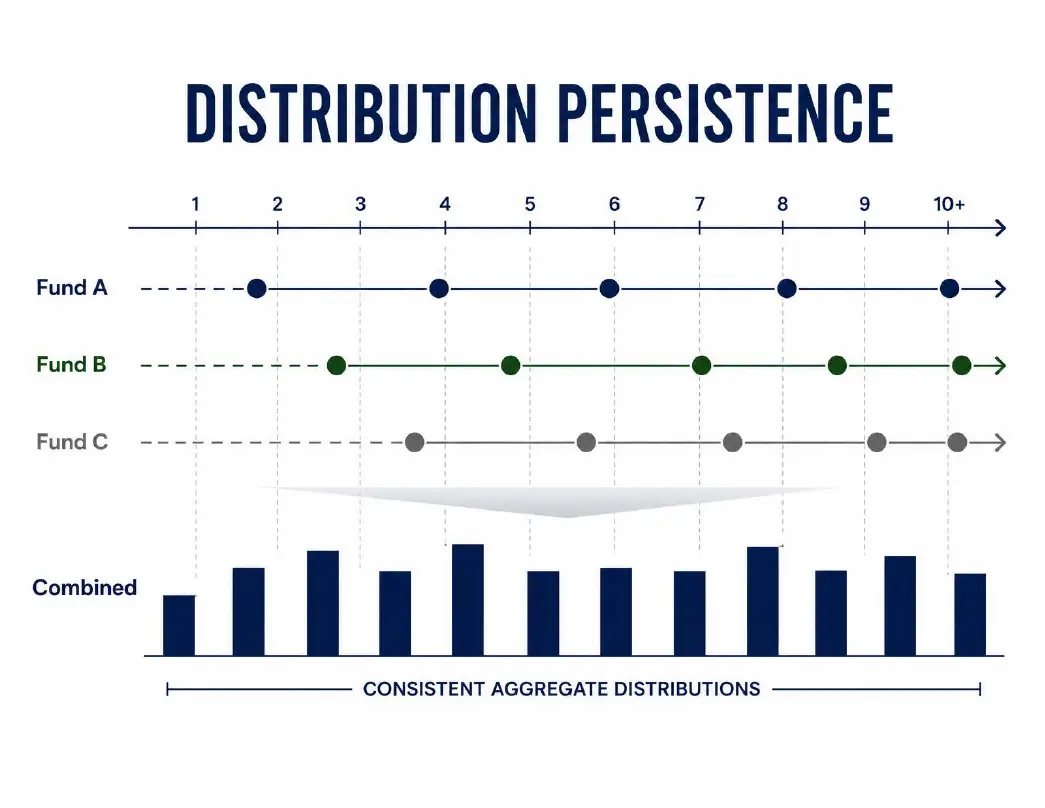
Unlike traditional fixed-income investments, private equity distributions are irregular and depend on the timing of portfolio realizations. Nevertheless, mature secondary portfolios often exhibit a relatively persistent pattern of cash generation because realizations occur across numerous portfolio companies rather than through a single liquidity event. This recurring cash flow profile provides greater visibility into future liquidity while supporting more consistent capital planning.
Analysis
Distribution persistence reflects the tendency for cash distributions to continue over multiple years as investments are realized progressively across the portfolio. Rather than occurring as isolated events, realizations typically overlap, creating a relatively stable stream of distributions despite variability in individual exits. This characteristic contributes to improved liquidity forecasting and distinguishes mature secondary portfolios from investments that rely upon a limited number of realization events.
Modeling Implications
Distribution persistence should be represented through serial correlation rather than independent annual cash flows. Persistence coefficients and overlapping realization schedules improve the realism of Monte Carlo simulations while producing more stable long-term cash flow projections.
4.10 Reinvestment Mechanics
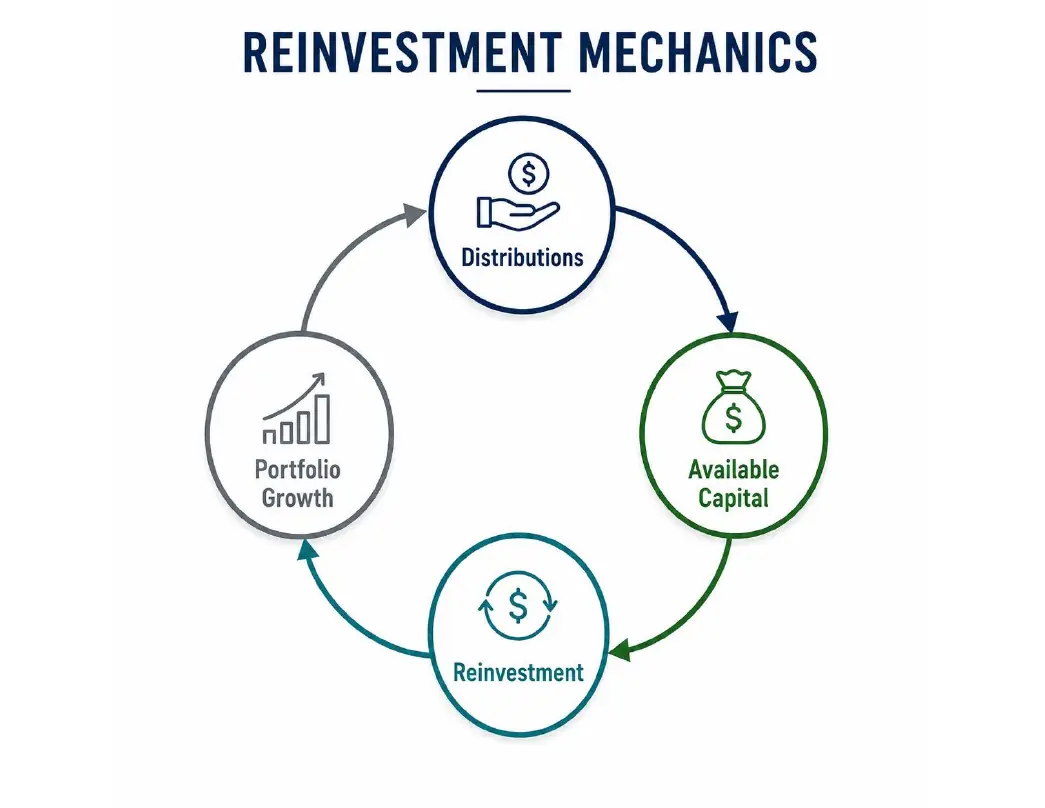
One of the defining characteristics of secondary investments is the ability to recycle distributed capital into new investment opportunities while existing portfolio assets continue to generate value. Earlier distributions increase the availability of deployable capital, allowing investors to compound returns through successive investment cycles and maintain long-term portfolio exposure without extending overall portfolio duration.
Analysis
As distributions are received, investors may redeploy capital into new private market opportunities, public markets, or other portfolio allocations. The ability to reinvest distributed capital before the original portfolio reaches full liquidation creates an additional source of long-term compounding and increases overall capital efficiency. Consequently, reinvestment timing becomes an important determinant of portfolio growth and total return over extended investment horizons.
Modeling Implications
Reinvestment assumptions should incorporate the timing of distributions, reinvestment delay, expected reinvestment return, and cash drag. Together, these parameters determine the compounding effect of recycled capital and influence long-term portfolio growth within stochastic portfolio simulations.
Chapter 4 Summary
The distinguishing characteristics of private equity secondaries extend beyond accelerated capital deployment and earlier liquidity. As demonstrated throughout this chapter, seasoned portfolios exhibit a unique cash flow profile characterized by compressed deployment periods, earlier distributions, declining residual value, shorter holding periods, and persistent realization activity. Collectively, these features create a more predictable economic lifecycle than is typically observed in primary private equity investments.
From a portfolio construction perspective, these cash flow characteristics are not merely descriptive—they define the parameters that govern investment behavior. Deployment timing, capital calls, NAV evolution, distribution persistence, remaining portfolio value, holding period, and reinvestment dynamics collectively determine portfolio liquidity, capital efficiency, and long-term compounding potential.
Accordingly, the quantitative framework established in this chapter provides the foundation for the portfolio modeling methodology developed throughout the remainder of this paper. Rather than treating private market investments as static return assumptions, secondary investments can be modeled as dynamic cash flow systems whose behavior evolves predictably through time under varying market conditions.
Chapter 5. Risk Framework
Quantifying Risk in Private Equity Secondaries
Chapter Introduction
Risk in private equity secondaries extends beyond market volatility and cannot be adequately evaluated using traditional public market risk metrics. Each investment is exposed to multiple sources of uncertainty arising from portfolio construction, transaction structure, fund management, financing conditions, and the underlying private assets. Effective due diligence therefore requires a multidimensional framework that evaluates both the probability and the potential impact of each risk factor throughout the investment lifecycle.
This chapter introduces a structured risk taxonomy designed specifically for secondary investments. Rather than categorizing risks simply as advantages or disadvantages, each risk is defined, evaluated using historical evidence, assessed under stressed market conditions, and translated into measurable variables suitable for quantitative portfolio modeling.
5.1 Market Risk
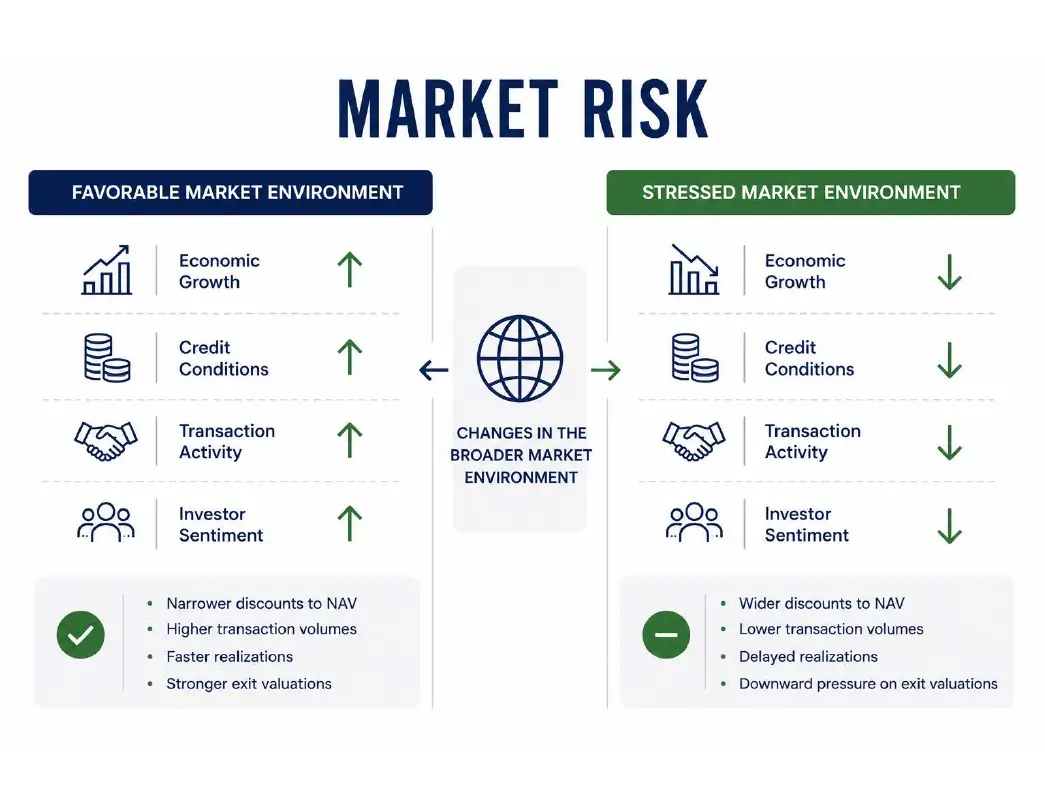
Market risk reflects the sensitivity of secondary investments to changes in the broader economic and financial environment. Although private market valuations are less volatile than public market prices on a day-to-day basis, secondary portfolios remain exposed to recessionary conditions, changes in investor sentiment, credit availability, and transaction activity. Market dislocations may reduce transaction volumes, widen secondary discounts, and delay realizations, even when the underlying portfolio companies continue to perform operationally.
Historical Behavior
Secondary markets have historically experienced wider pricing discounts and slower transaction activity during periods of financial stress. However, market dislocations have also created attractive entry opportunities for well-capitalized investors able to provide liquidity.
Stress Sensitivity
High
Monitoring Metrics
- Secondary market discount to NAV
- Public market volatility
- Credit spreads
- Transaction volume
Suggested Simulation Variables
- Public market shock factor
- Secondary pricing discount
- Exit delay multiplier
- Correlation with public equities
Confidence
High
5.2 Interest Rate Risk
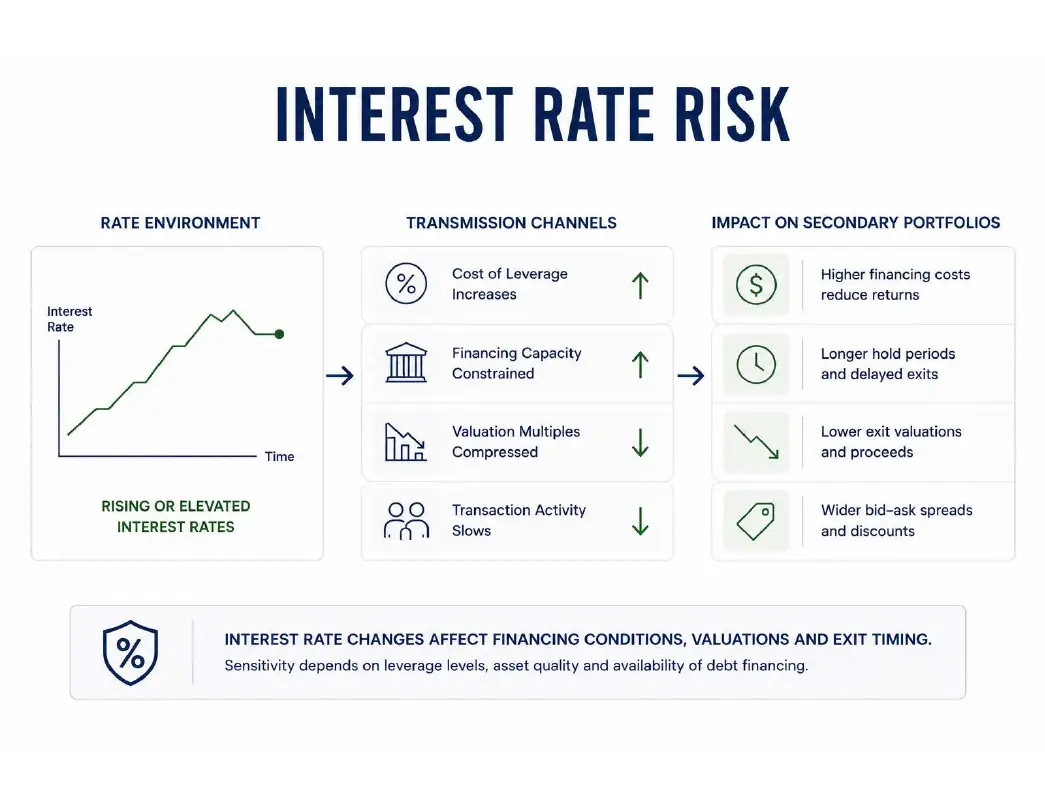
Interest rates influence private equity secondaries both directly and indirectly through financing costs, discount rates, valuation multiples, and transaction activity. Rising interest rates generally increase the cost of leverage, reduce acquisition financing capacity, and place downward pressure on asset valuations, particularly for highly leveraged buyout portfolios. Conversely, stable or declining rates often improve financing conditions and support increased transaction volumes.
Historical Behavior
Periods of rapidly rising interest rates have historically coincided with slower private market transaction activity, wider bid-ask spreads, and delayed realizations. The magnitude of the effect varies by sector, leverage profile, and availability of acquisition financing.
Stress Sensitivity
Medium–High
Monitoring Metrics
- Benchmark interest rates
- Credit spreads
- Financing availability
- Average leverage multiples
Suggested Simulation Variables
- Interest rate path
- Leverage cost adjustment
- Exit multiple sensitivity
- Financing availability factor
Confidence
High
5.3 Liquidity Risk
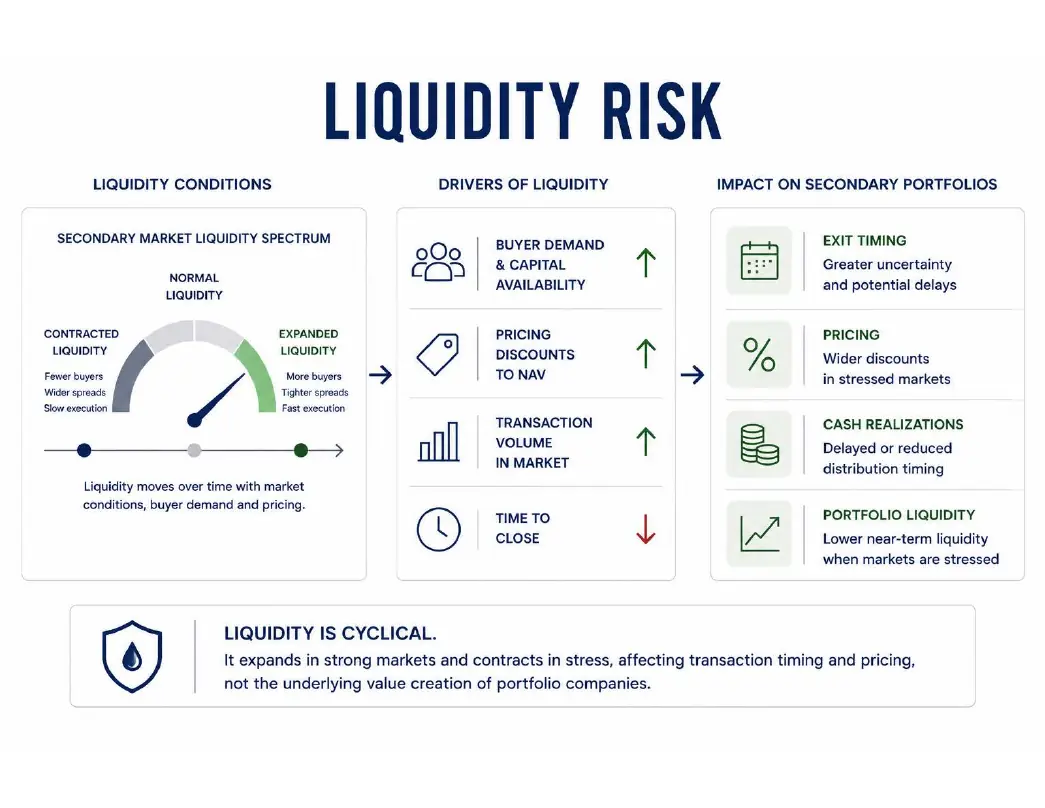
Liquidity risk represents the possibility that investors may be unable to sell or realize investments at expected prices or within anticipated timeframes. Although secondary markets provide substantially greater liquidity than traditional private equity commitments, liquidity remains episodic and depends upon market conditions, buyer demand, transaction pricing, and the quality of the underlying portfolio. Liquidity risk primarily affects transaction timing rather than the intrinsic value of portfolio companies.
Historical Behavior
Secondary market liquidity has expanded significantly over the past two decades, with transaction volumes increasing and pricing becoming more efficient. Nevertheless, liquidity typically contracts during periods of market stress as buyers become more selective and transaction execution slows.
Stress Sensitivity
Medium
Monitoring Metrics
- Secondary transaction volume
- Average time to close
- Bid-ask spread
- Pricing discount to NAV
Suggested Simulation Variables
- Liquidity probability
- Exit timing distribution
- Pricing adjustment
- Execution delay
Confidence
High
5.4 Valuation Risk
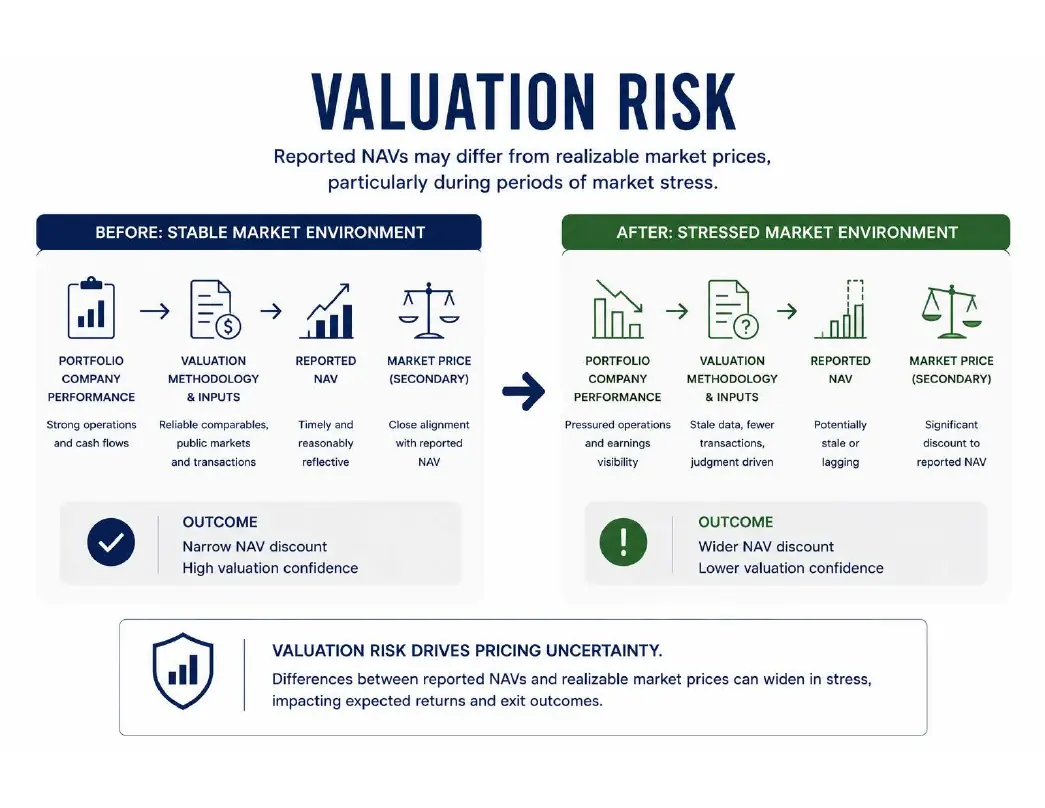
Valuation risk arises from uncertainty regarding the fair market value of underlying portfolio companies and fund interests. Unlike publicly traded securities, private assets are valued periodically using appraisal methodologies, comparable transactions, and discounted cash flow analyses. As a result, reported net asset values may differ from realizable market prices, particularly during periods of market stress or rapidly changing economic conditions.
Historical Behavior
Secondary pricing has historically deviated from reported NAV during periods of elevated uncertainty, with discounts widening as market participants reassess valuation assumptions and liquidity conditions.
Stress Sensitivity
High
Monitoring Metrics
- Discount to NAV
- Valuation multiple changes
- Pricing dispersion
- Appraisal frequency
Suggested Simulation Variables
- NAV discount factor
- Valuation volatility
- Pricing dispersion
- Recovery period
Confidence
High
5.5 Exit Risk
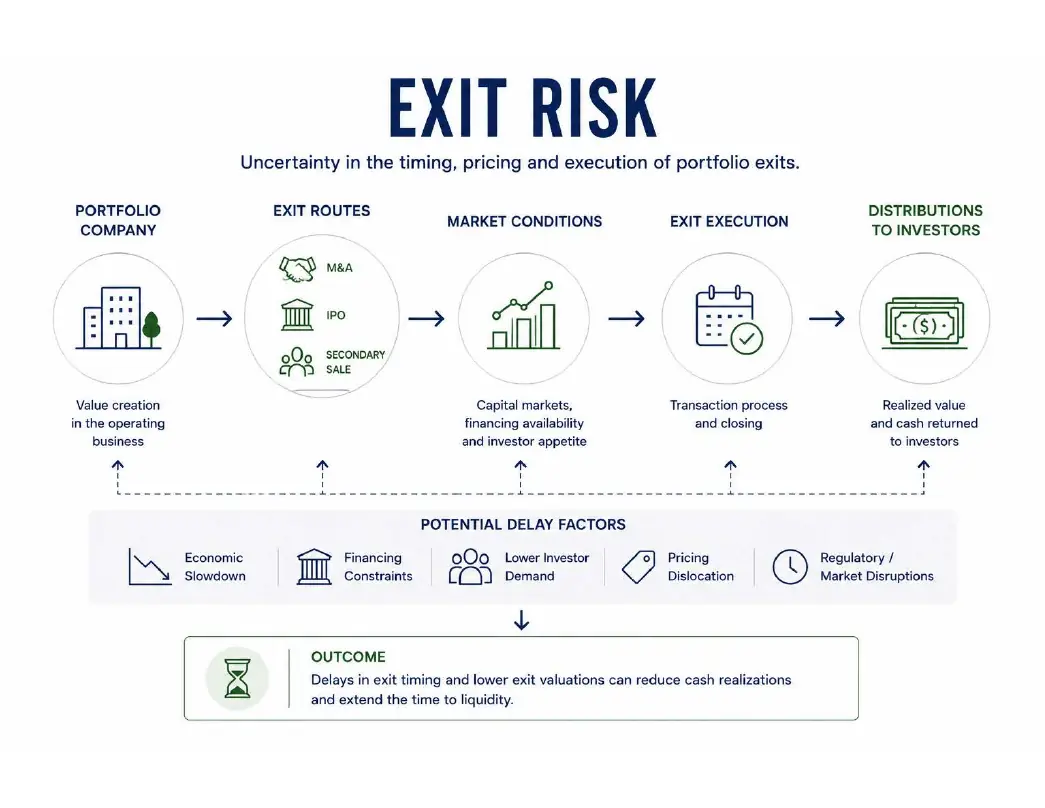
Exit risk represents the uncertainty surrounding the timing, pricing, and successful execution of portfolio realizations. Private equity investments depend upon acquisitions, recapitalizations, public offerings, or secondary transactions to generate liquidity. Changes in capital markets, financing conditions, or buyer demand may delay exits and postpone distributions without necessarily affecting the long-term operating performance of the underlying businesses.
Historical Behavior
Exit activity has historically slowed during recessionary environments and periods of reduced acquisition financing, extending holding periods and delaying distributions until market conditions improve.
Stress Sensitivity
High
Monitoring Metrics
- Exit volume
- Average holding period
- M&A activity
- IPO market conditions
Suggested Simulation Variables
- Exit delay
- Exit probability
- Realization timing
- Exit valuation adjustment
Confidence
High
5.6 Vintage Risk
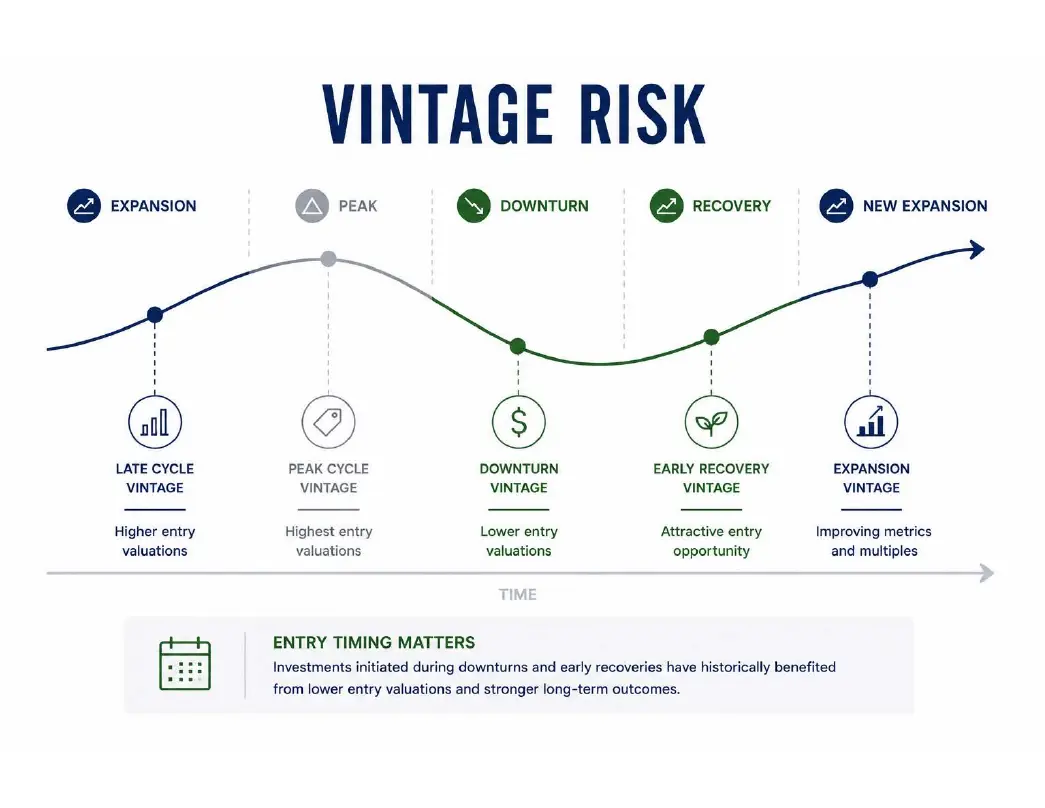
Vintage risk reflects the influence of the economic and market environment at the time capital is deployed. Entry during periods of elevated valuations or economic expansion may reduce future return potential, while investments initiated during periods of market dislocation have historically benefited from more attractive entry pricing and stronger subsequent recoveries. Although secondary portfolios diversify vintage exposure by acquiring seasoned assets, vintage conditions continue to influence long-term performance.
Historical Behavior
Performance dispersion across private equity vintages has historically been significant, with investments made during recessionary or post-recession environments frequently outperforming those initiated during periods of peak market valuations.
Stress Sensitivity
Medium
Monitoring Metrics
- Entry valuation
- Economic cycle
- Vintage year
- Purchase discount
Suggested Simulation Variables
- Entry multiple
- Vintage adjustment
- Initial discount
- Market cycle factor
Confidence
Medium–High
5.7 Manager Risk
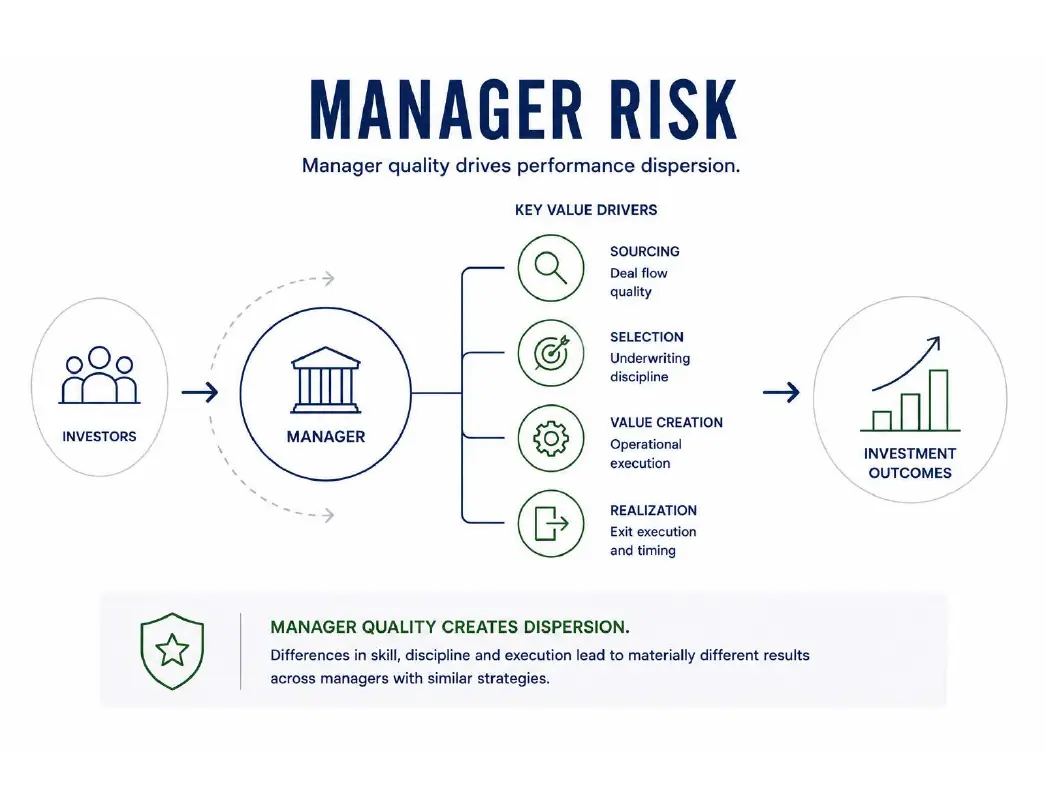
Manager risk reflects the influence of the general partner's investment judgment, portfolio construction, operational oversight, and value creation capabilities on investment outcomes. Even within similar market environments, substantial performance dispersion exists across managers, making manager selection one of the most important determinants of long-term private equity returns.
Historical Behavior
Academic research and industry experience consistently demonstrate persistent return dispersion among private equity managers. Differences in sourcing, operational expertise, sector specialization, and portfolio management have historically produced materially different investment outcomes across comparable strategies.
Stress Sensitivity
Medium
Monitoring Metrics
- Historical IRR
- DPI / TVPI
- Loss ratio
- Portfolio concentration
- Team stability
Suggested Simulation Variables
- Alpha adjustment
- Return dispersion
- Loss probability
- Manager persistence factor
Confidence
High
5.8 Selection Risk
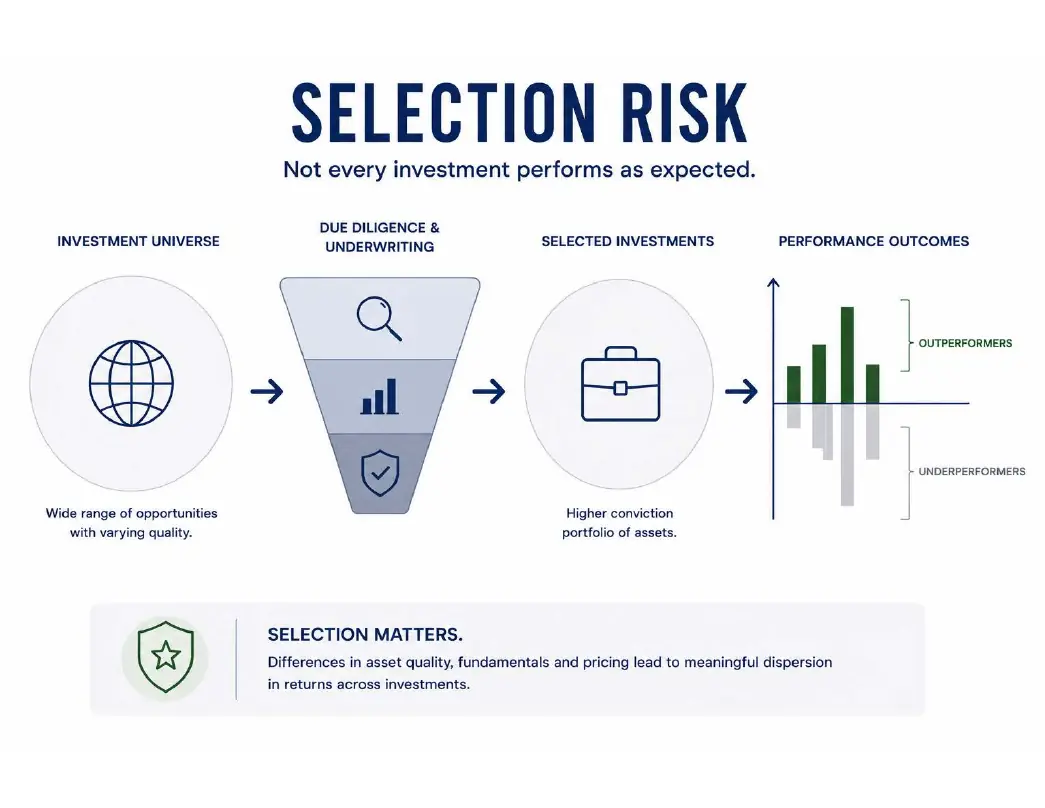
Selection risk reflects the possibility that individual investments chosen for acquisition may underperform expectations despite favorable market conditions. Asset quality, sector exposure, geographic concentration, competitive positioning, and purchase pricing all influence long-term investment outcomes. Effective due diligence seeks to reduce selection risk through disciplined underwriting and portfolio diversification.
Historical Behavior
Performance dispersion across individual portfolio companies remains significant, even within the same vintage and manager.
Stress Sensitivity
Medium
Monitoring Metrics
- Entry valuation
- Sector exposure
- Company fundamentals
- Purchase discount
Suggested Simulation Variables
- Asset selection alpha
- Default probability
- Return dispersion
Confidence
Medium–High
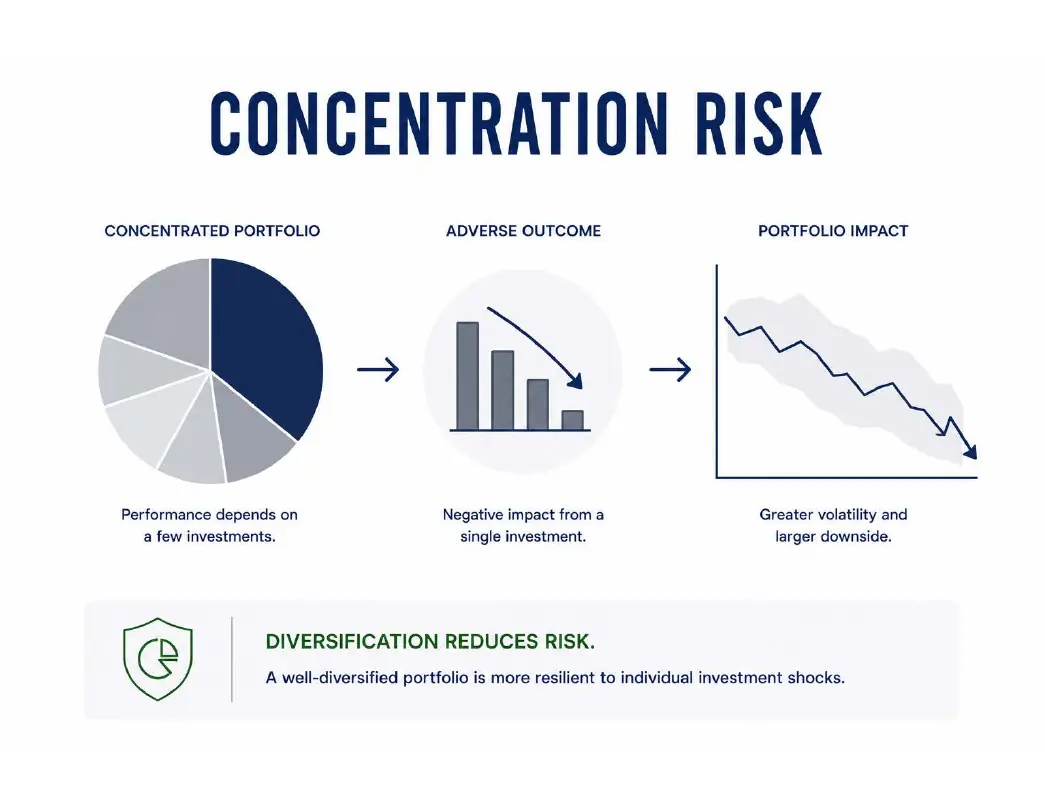
5.9 Concentration Risk
Concentration risk arises when portfolio performance becomes overly dependent upon a limited number of investments, sectors, geographies, or counterparties. Diversification reduces the impact of individual adverse outcomes and generally improves portfolio resilience across changing market environments.
Historical Behavior
More concentrated portfolios have historically exhibited greater return dispersion and higher downside sensitivity during stressed market conditions.
Stress Sensitivity
High
Monitoring Metrics
- Largest investment weight
- Sector concentration
- Geographic concentration
Suggested Simulation Variables
- Concentration multiplier
- Correlation adjustment
- Portfolio diversification score
Confidence
High
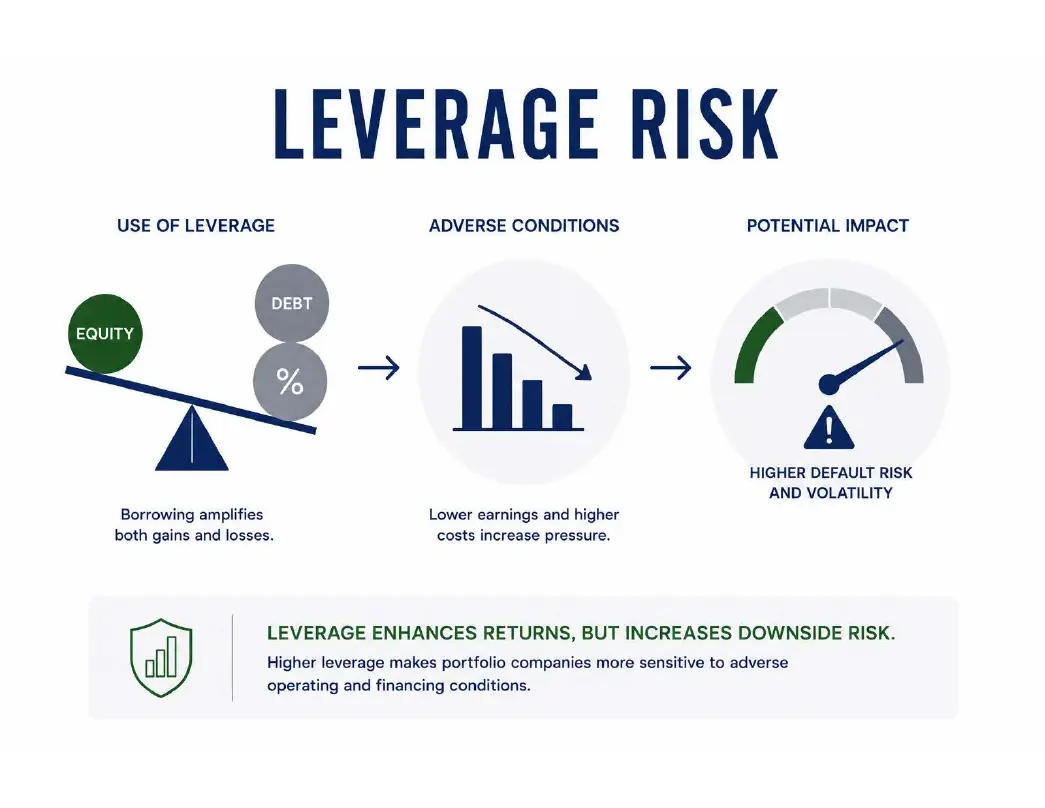
5.10 Leverage Risk
Leverage enhances return potential while increasing sensitivity to adverse operating performance, refinancing conditions, and rising financing costs. The degree of financial leverage employed within portfolio companies remains one of the primary determinants of downside risk during periods of economic stress.
Historical Behavior
Periods of rising interest rates and tightening credit conditions have historically increased default risk among highly leveraged companies.
Stress Sensitivity
High
Monitoring Metrics
- Debt / EBITDA
- Interest coverage
- Financing cost
Suggested Simulation Variables
- Leverage multiplier
- Refinancing probability
- Default sensitivity
Confidence
High
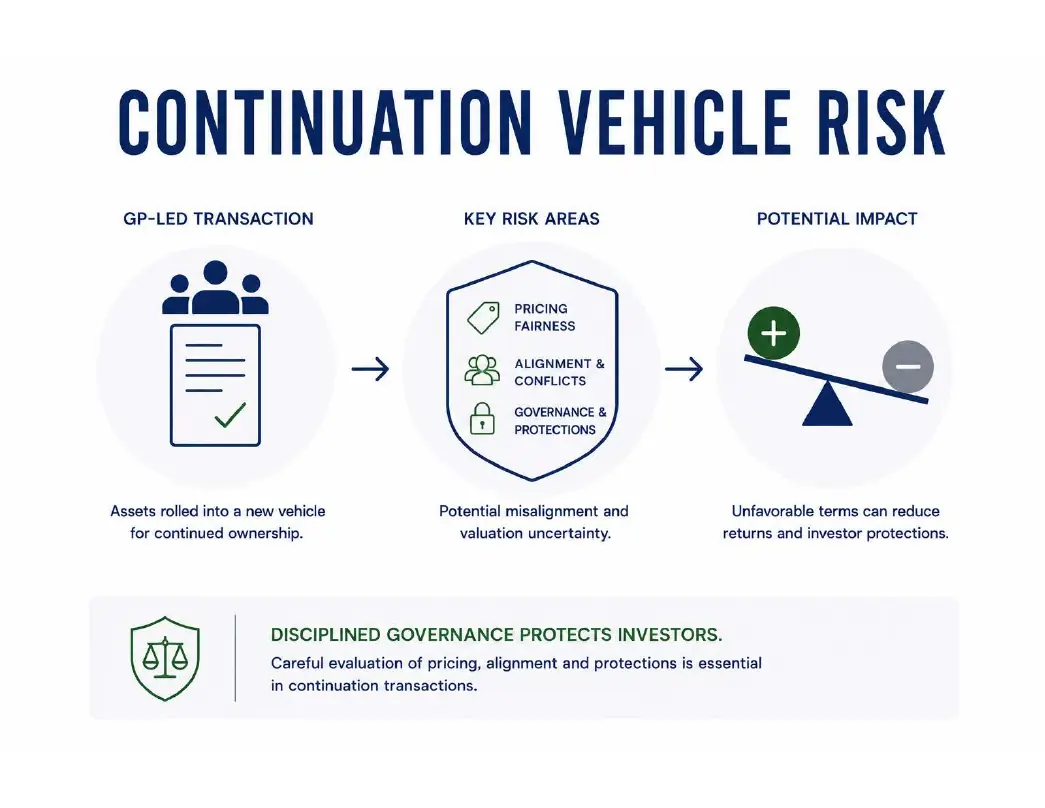
5.11 Continuation Vehicle Risk
Continuation vehicles introduce unique considerations relating to pricing, governance, conflicts of interest, and alignment between general partners and investors. Although continuation transactions have become an important source of liquidity, careful evaluation remains necessary to ensure fair valuation and appropriate investor protections.
Historical Behavior
Continuation vehicles have expanded rapidly as the secondary market has matured, with governance quality becoming an increasingly important differentiator.
Stress Sensitivity
Medium
Monitoring Metrics
- Pricing fairness
- LP participation
- GP commitment
Suggested Simulation Variables
- Pricing adjustment
- Governance score
- Conflict probability
Confidence
Medium
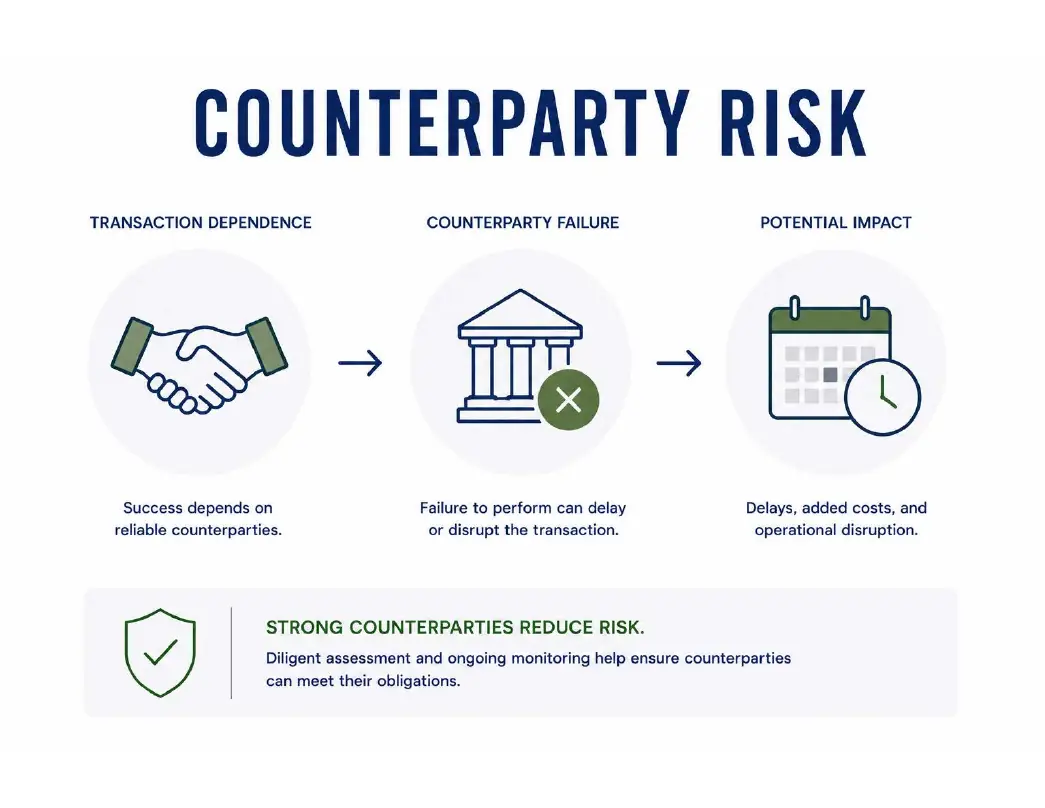
5.12 Counterparty Risk
Counterparty risk reflects the possibility that a transaction participant—including buyers, sellers, financing providers, administrators, or service providers—fails to perform contractual obligations. Although generally lower than market-related risks, counterparty failures may delay transactions, increase operational complexity, or affect settlement timing.
Historical Behavior
Counterparty risk has generally remained limited but becomes more relevant during periods of financial market disruption.
Stress Sensitivity
Low–Medium
Monitoring Metrics
- Counterparty quality
- Settlement history
- Creditworthiness
Suggested Simulation Variables
- Settlement delay
- Counterparty failure probability
Confidence
Medium
5.13 Operational Risk
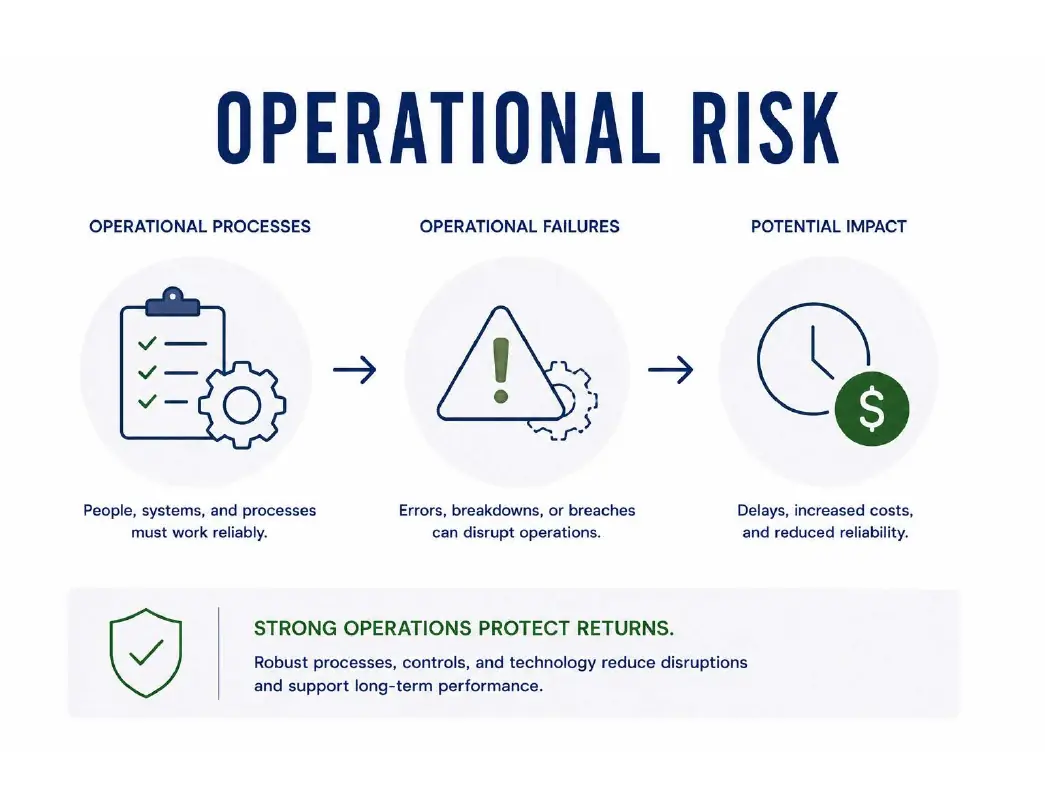
Operational risk encompasses failures in administration, reporting, transaction processing, compliance, cybersecurity, and operational controls. While operational failures rarely alter underlying asset value, they may increase costs, delay execution, and reduce reporting quality.
Historical Behavior
Operational risk has declined as private market infrastructure has become increasingly institutionalized and technology-enabled.
Stress Sensitivity
Low
Monitoring Metrics
- Processing accuracy
- Reporting timeliness
- Audit findings
Suggested Simulation Variables
- Operational event probability
- Processing delay
Confidence
Medium
5.14 Governance & Legal Risk
Governance and legal risk arise from fund documentation, investor rights, regulatory requirements, fiduciary responsibilities, and jurisdictional considerations. Strong governance frameworks reduce uncertainty, improve transparency, and support effective decision-making throughout the investment lifecycle.

Historical Behavior
Governance quality has become an increasingly important consideration as the secondary market has expanded into more complex GP-led transactions and continuation vehicles.
Stress Sensitivity
Medium
Monitoring Metrics
- Governance structure
- Regulatory compliance
- Investor protections
- Legal exceptions
Suggested Simulation Variables
- Governance quality score
- Legal event probability
- Compliance adjustment
Confidence
Medium–High
Chapter 5 Summary
The risks associated with private equity secondaries extend beyond conventional measures of volatility or downside return. Market conditions, valuation uncertainty, liquidity, manager quality, portfolio construction, financing, governance, and operational execution each influence investment outcomes through different mechanisms and over different time horizons. Effective due diligence therefore requires a multidimensional framework that evaluates both the likelihood and the potential impact of each source of uncertainty.
Rather than considering these risks independently, institutional portfolio construction benefits from translating each risk into measurable variables that can be monitored, stress-tested, and incorporated into probabilistic portfolio models. This approach recognizes that investment risk is dynamic, evolves throughout the investment lifecycle, and interacts with other portfolio characteristics rather than existing in isolation.
Accordingly, the framework presented in this chapter serves not only as a due diligence checklist but also as the foundation for quantitative portfolio modeling. By converting qualitative investment risks into measurable simulation parameters, private market investments can be evaluated under a broad range of economic and market scenarios while maintaining consistency across portfolio construction, stress testing, and Monte Carlo analysis.
Framework Translation: From Risk Assessment to Portfolio Simulation
The Alts Custodian methodology extends traditional due diligence by translating each identified risk into explicit modeling variables. Rather than simply classifying risks as high or low, each factor is represented by parameters that can be incorporated into stochastic portfolio simulations and scenario analysis.
| Risk Modeling Parameter | Typical Assessment | Simulation Representation |
|---|---|---|
| Probability of Occurrence | Low–High | Bernoulli / Event Probability |
| Severity of Impact | Low–High | Shock Multiplier |
| Expected Recovery | Months / Years | Recovery Lag |
| Correlation with Other Risks | Low–High | Correlation Matrix |
| Confidence in Assumption | Low–High | Model Weight |
This standardized framework enables risks to be modeled consistently across investment opportunities, providing a direct connection between qualitative due diligence and quantitative portfolio construction. Rather than treating investment risk as a static observation, the methodology allows each risk factor to evolve under changing market conditions, producing a more realistic representation of portfolio behavior over time.
Chapter 6. Portfolio Construction Framework
Translating Investment Characteristics into Portfolio Construction Variables
Chapter Introduction
The characteristics of private equity secondaries become meaningful only when evaluated within the context of a diversified portfolio. Return potential, income generation, downside resilience, liquidity, and diversification benefits should not be assessed independently but rather as interacting portfolio attributes that collectively influence long-term investment outcomes.
This chapter introduces a quantitative framework that translates the economic characteristics identified throughout the previous chapters into measurable portfolio construction variables. Each variable represents a distinct dimension of portfolio behavior and serves as a standardized input within the Alts Custodian portfolio construction and simulation methodology. Rather than evaluating investments using a single performance metric, the framework considers multiple dimensions simultaneously to provide a more comprehensive assessment of portfolio quality.
6.1 Return Characteristics
Expected return should be evaluated alongside recurring income generation and return variability rather than as an isolated performance metric. Secondary investments frequently improve portfolio efficiency by combining capital appreciation with earlier cash distributions while maintaining moderate volatility. The interaction of these characteristics determines the overall contribution of a secondary allocation to long-term portfolio growth.
Exhibit 1 — Return Characteristics
| Portfolio Characteristic | Portfolio Construction Role | Engine Variable |
|---|---|---|
| Expected Return | Long-term appreciation | CAGR |
| Income Generation | Cash flow production | Distribution Yield |
| Volatility | Return variability | Sigma |
Portfolio Interpretation
Portfolio construction should evaluate return, income, and volatility simultaneously. Investments with similar expected returns may produce materially different investor outcomes depending on income timing and return dispersion. These variables collectively define the expected return profile used within the portfolio construction engine.
6.2 Market Characteristics
Private equity secondaries should be evaluated according to their interaction with broader financial markets rather than independently. Beta measures sensitivity to systematic market movements, while correlation determines the degree of diversification provided within a multi-asset portfolio. Together, these characteristics influence overall portfolio stability and diversification efficiency.
Exhibit 2 — Market Characteristics
| Portfolio Characteristic | Portfolio Construction Role | Engine Variable |
|---|---|---|
| Beta | Market sensitivity | Beta |
| Correlation | Diversification benefit | Correlation Matrix |
Portfolio Interpretation
Lower market sensitivity and moderate correlation can materially improve portfolio diversification by reducing dependence on traditional public market performance. These characteristics determine how secondary investments interact with the broader portfolio during changing market environments.
6.3 Economic Resilience
Portfolio resilience depends upon investment behavior under changing macroeconomic conditions rather than average long-term returns alone. Inflation sensitivity, recession performance, and recovery characteristics determine the portfolio's ability to preserve capital and recover following periods of economic stress.
Exhibit 3 — Economic Resilience
| Portfolio Characteristic | Portfolio Construction Role | Engine Variable |
|---|---|---|
| Inflation Sensitivity | Inflation response | Inflation Beta |
| Recession Sensitivity | Downturn resilience | Stress Multiplier |
| Recovery Time | Speed of recovery | Recovery Lag |
Portfolio Interpretation
Economic resilience extends beyond downside protection. The duration required to recover from adverse market conditions significantly influences long-term compounding and overall portfolio efficiency. These variables govern portfolio behavior under stress scenarios within the simulation framework.
6.4 Portfolio Quality
Portfolio quality reflects characteristics that improve investment consistency rather than simply increasing expected returns. Diversification, liquidity, income stability, and capital preservation collectively determine the reliability and structural resilience of long-term portfolio performance.
Exhibit 4 — Portfolio Quality
| Portfolio Characteristic | Portfolio Construction Role | Engine Variable |
|---|---|---|
| Diversification | Risk reduction | Diversification Score |
| Liquidity | Capital accessibility | Liquidity Score |
| Income Stability | Cash flow persistence | Persistence Factor |
| Capital Preservation | Downside resilience | Preservation Score |
Portfolio Interpretation
Higher-quality portfolios generate more consistent investor outcomes by balancing growth with liquidity, recurring income, and downside resilience. These variables measure structural portfolio strength rather than absolute return potential.
6.5 Downside Characteristics
Portfolio construction must evaluate not only expected performance but also the consequences of unfavorable market conditions. Expected downside and sequence risk measure the impact of adverse returns, particularly during the early stages of an investment horizon when losses have the greatest influence on long-term compounding.
Exhibit 5 — Downside Characteristics
| Portfolio Characteristic | Portfolio Construction Role | Engine Variable |
|---|---|---|
| Expected Downside | Maximum expected decline | Downside Multiplier |
| Sequence Risk | Early loss sensitivity | Sequence Shock |
Portfolio Interpretation
Downside characteristics provide a direct assessment of portfolio resilience under adverse market conditions. Understanding both the magnitude and timing of potential losses improves portfolio construction by balancing expected return against capital preservation and recovery potential.
6.6 Economic Resilience
Portfolio resilience is determined not only by expected long-term returns but also by investment behavior under adverse macroeconomic conditions. Inflationary environments, economic recessions, recovery dynamics, and downside characteristics collectively determine the portfolio's ability to preserve capital while maintaining long-term compounding. These characteristics are particularly important when evaluating private market allocations that span multiple economic cycles.
Exhibit 6 — Economic Resilience
| Portfolio Characteristic | Portfolio Construction Role | Engine Variable |
|---|---|---|
| Inflation Sensitivity | Inflation response | Inflation Beta |
| Recession Sensitivity | Downturn resilience | Stress Multiplier |
| Recovery Time | Recovery duration | Recovery Lag |
| Expected Downside | Maximum decline | Downside Multiplier |
Portfolio Interpretation
A resilient portfolio is not defined solely by smaller losses during market downturns but by its ability to recover efficiently while continuing to generate long-term value. Inflation sensitivity, recession behavior, recovery duration, and downside protection interact to determine the structural resilience of the overall portfolio. Together, these variables govern scenario analysis and stress-testing within the Alts Custodian Portfolio Construction Engine.
6.7 Portfolio Efficiency
Portfolio efficiency reflects the extent to which an investment improves the overall quality of a diversified portfolio beyond its standalone return characteristics. Diversification, liquidity, income stability, capital preservation, and sequence risk each contribute to the consistency and sustainability of long-term investment performance while reducing portfolio fragility during changing market conditions.
Exhibit 7 — Portfolio Efficiency
| Portfolio Characteristic | Portfolio Construction Role | Engine Variable |
|---|---|---|
| Diversification Contribution | Portfolio risk reduction | Diversification Score |
| Liquidity Score | Capital accessibility | Liquidity Score |
| Income Stability | Cash flow consistency | Persistence Factor |
| Capital Preservation | Downside resilience | Preservation Score |
| Sequence Risk | Early loss sensitivity | Sequence Shock |
Portfolio Interpretation
Efficient portfolios combine return generation with structural stability. Investments that improve diversification, maintain liquidity, generate persistent cash flows, preserve capital, and reduce sequence risk contribute disproportionately to long-term portfolio performance despite exhibiting similar standalone returns. These variables provide the quantitative basis for evaluating overall portfolio quality and become standardized inputs within deterministic projections, scenario analysis, and Monte Carlo simulation.

Chapter 6 Summary
The characteristics presented throughout this chapter establish the quantitative foundation for portfolio construction. Rather than evaluating private equity secondaries using isolated measures of return or risk, the Alts Custodian framework assesses each investment across multiple dimensions that collectively determine long-term portfolio behavior. Expected return, market sensitivity, economic resilience, diversification, liquidity, income stability, capital preservation, and downside characteristics together provide a more complete representation of investment quality than any single performance metric.
The objective of portfolio construction is therefore not to maximize individual investment returns, but to optimize the interaction of these characteristics within a diversified portfolio. Each portfolio attribute influences the behavior of the others, creating a dynamic system in which risk, return, liquidity, and resilience evolve simultaneously under changing market conditions.
Within the Alts Custodian methodology, every portfolio characteristic is translated into a standardized engine input. This conversion enables deterministic projections, scenario analysis, structural resilience testing, and Monte Carlo simulation to operate from a consistent quantitative framework. By replacing subjective assessments with measurable variables, portfolio construction becomes transparent, repeatable, and directly comparable across investment opportunities.
Chapter 7. Structural Resilience Framework
Stress Testing Private Equity Secondaries Under Alternative Market Regimes
Chapter Introduction
Expected returns represent only one possible outcome. Institutional portfolio construction requires evaluating investment behavior under a broad range of market environments, including financial crises, liquidity disruptions, valuation resets, and changing macroeconomic conditions. Stress testing extends traditional analysis by measuring portfolio resilience rather than average performance.
The Alts Custodian Structural Resilience Framework evaluates secondary investments under standardized historical and hypothetical scenarios. Each scenario isolates a distinct source of market stress and assesses its effect on pricing, liquidity, cash flows, valuation, and exit timing. Together, these scenarios provide the foundation for deterministic stress testing and structural resilience analysis within the portfolio construction framework.
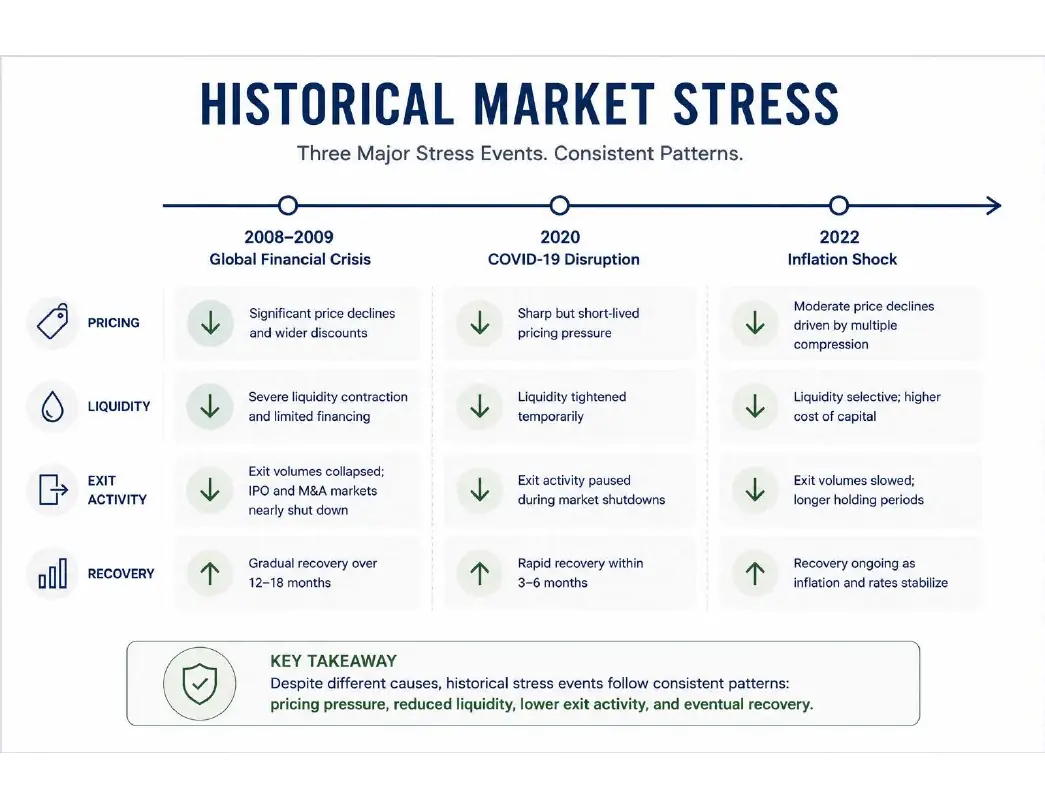
7.1 Historical Market Stress
Historical crises provide the most objective evidence of investment behavior under extreme market conditions. Although each event originated from different economic drivers, periods such as the Global Financial Crisis, the COVID-19 market disruption, and the 2022 inflation shock demonstrate how private market investments respond when liquidity contracts, financing conditions deteriorate, and investor confidence declines. These observations provide the empirical basis for calibrating stress assumptions rather than relying solely on theoretical scenarios.
Portfolio Interpretation
Historical stress events reveal recurring patterns despite their different origins. Transaction activity slows, pricing discounts widen, liquidity becomes more limited, and realizations are often delayed. These observed behaviors provide the benchmark for evaluating structural resilience across future market environments.
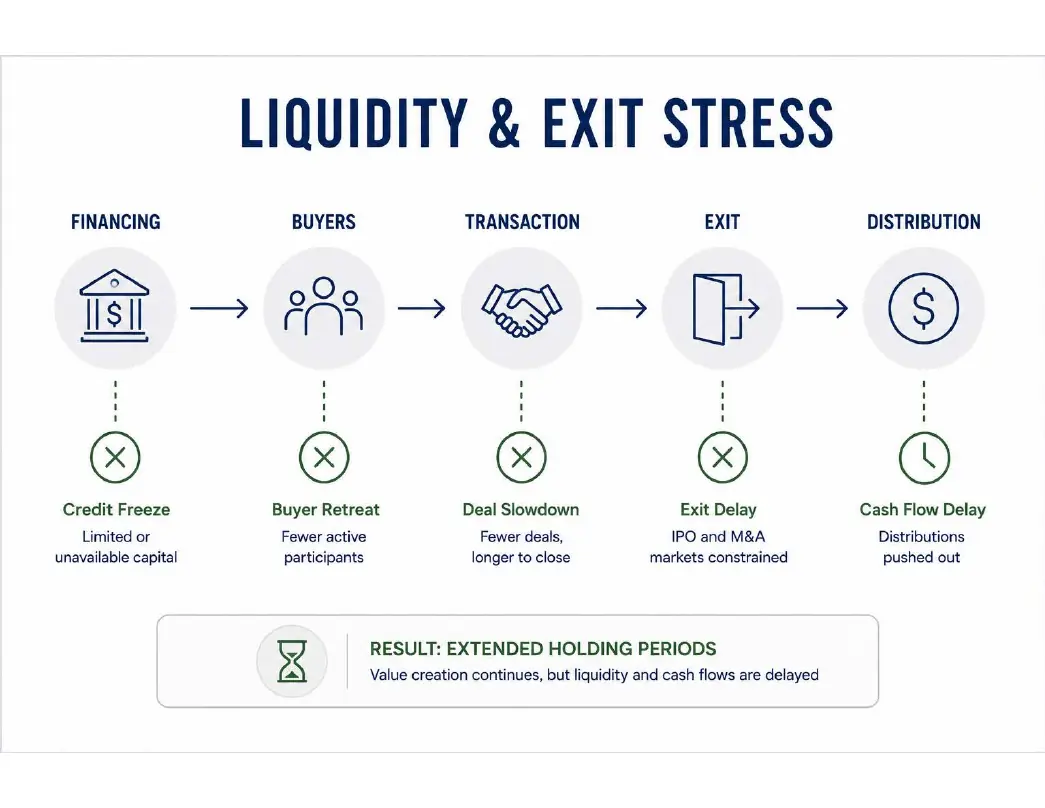
7.2 Liquidity & Exit Stress
Liquidity stress does not necessarily reduce the intrinsic value of portfolio companies but instead affects the ability to transact efficiently. Financing constraints, reduced buyer participation, IPO market closures, and slower merger activity may significantly delay realizations while extending holding periods. For secondary investments, liquidity events primarily influence the timing of cash flows rather than long-term value creation.
Portfolio Interpretation
Liquidity disruptions primarily affect transaction timing, portfolio duration, and cash flow availability. Although long-term value creation may remain intact, reduced market liquidity can postpone distributions, widen pricing discounts, and temporarily reduce capital recycling efficiency.
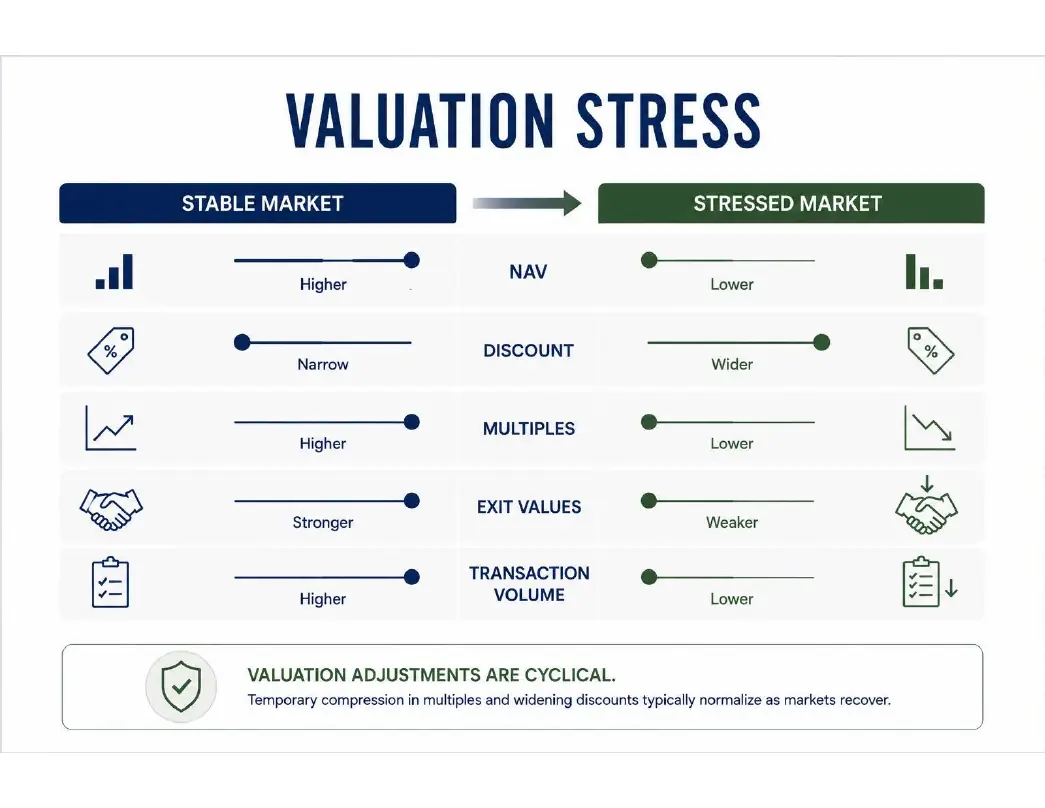
7.3 Valuation Stress
Valuation stress reflects changes in market pricing resulting from multiple compression, financing conditions, interest rate movements, and declining transaction activity. During periods of market uncertainty, reported net asset values and realizable market prices may temporarily diverge as buyers require higher expected returns and market participants reassess valuation assumptions. These adjustments influence portfolio valuation even when underlying operating performance remains relatively stable.
Portfolio Interpretation
Valuation adjustments are typically cyclical rather than permanent. Market dislocations may temporarily widen discounts and compress valuation multiples before gradually normalizing as financing conditions improve and transaction activity resumes. Stress testing therefore distinguishes temporary valuation effects from permanent impairment of underlying portfolio value.
7.4 Economic Regimes
Portfolio behavior is determined not only by isolated market events but also by the broader economic regime in which investments operate. Expansion, soft landings, recessions, recoveries, and periods of financial stress each produce distinct combinations of pricing, liquidity, financing conditions, and exit activity. Rather than forecasting a single outcome, the Structural Resilience Framework evaluates portfolio behavior across multiple economic environments, allowing investment performance to be assessed under a range of plausible market conditions.
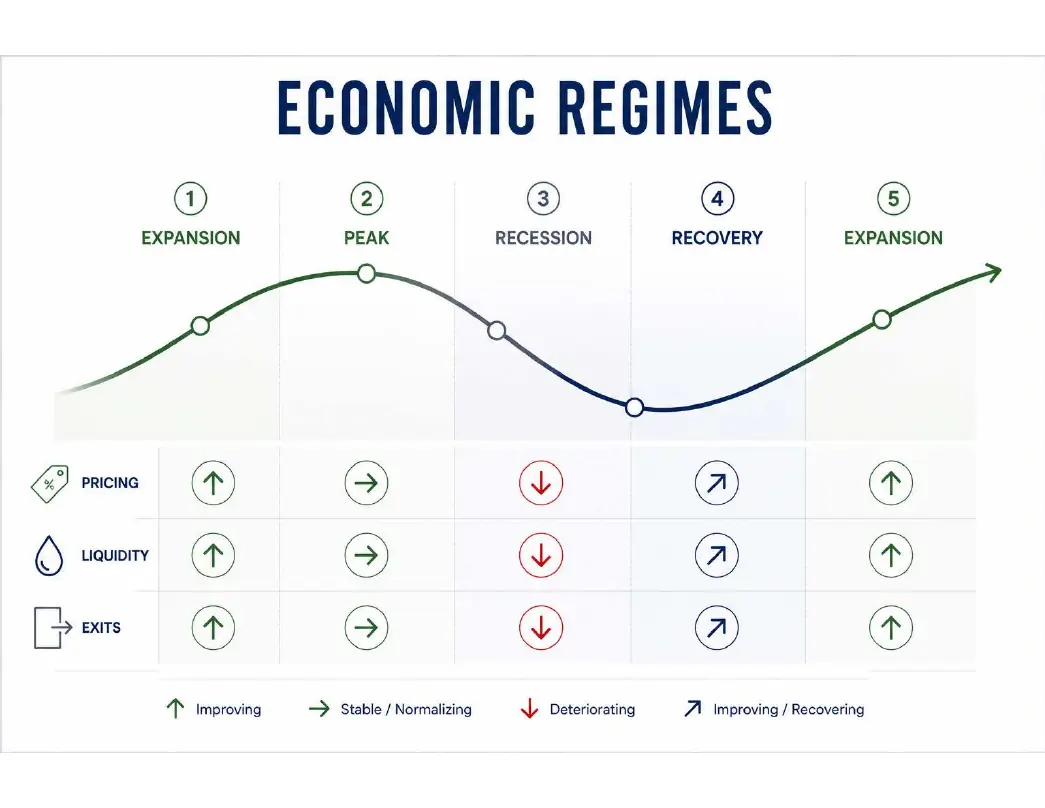
Portfolio Interpretation
Each economic regime influences portfolio behavior through a different combination of pricing, liquidity, valuation, and realization dynamics. Modeling these environments individually provides a more comprehensive assessment of structural portfolio resilience than relying on average historical returns alone.
7.5 Structural Resilience Variables
Stress testing becomes actionable only when market scenarios are translated into measurable portfolio variables. Within the Alts Custodian Structural Resilience Framework, every scenario modifies a standardized set of engine inputs governing pricing, valuation, liquidity, cash flows, and realization timing. This approach allows deterministic portfolio projections and Monte Carlo simulations to respond dynamically to changing market conditions while maintaining methodological consistency across investment opportunities.
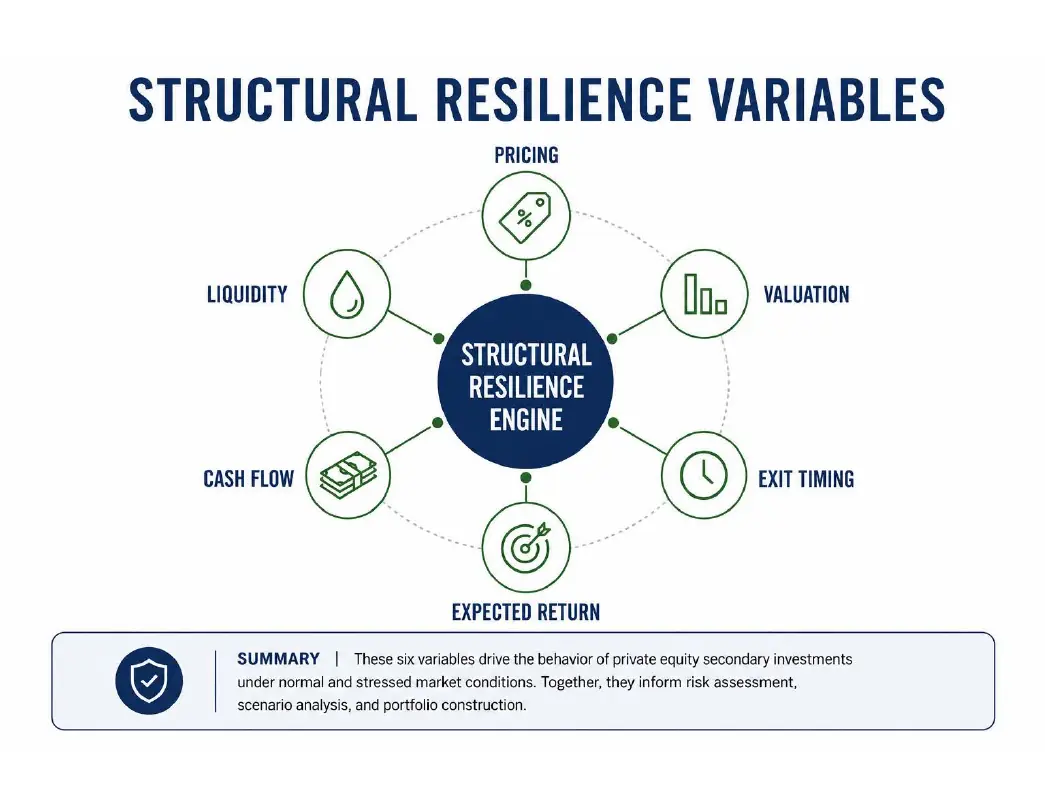
Portfolio Interpretation
The Structural Resilience Framework serves as the bridge between qualitative market scenarios and quantitative portfolio simulation. By converting each market environment into standardized engine variables, the methodology enables portfolio behavior to be evaluated consistently under both expected and stressed economic conditions.
Chapter 7 Summary
Historical crises, liquidity disruptions, valuation resets, and changing economic environments influence private equity investments through recurring patterns that affect pricing, liquidity, cash flows, valuation, and exit timing. Although the underlying causes differ, these transmission mechanisms exhibit sufficient consistency to support standardized stress-testing assumptions.
Within the Alts Custodian Structural Resilience Framework, each market scenario is translated into a common set of quantitative engine variables governing deterministic projections, scenario analysis, and Monte Carlo simulation. This methodology enables investment opportunities to be evaluated consistently across both expected and adverse market conditions while providing a transparent framework for measuring structural portfolio resilience.
Chapter 8. Monte Carlo Framework
Modeling Uncertainty in Private Equity Secondaries
Chapter Introduction
Deterministic portfolio projections estimate a single expected outcome based on average assumptions. While useful for establishing a baseline expectation, deterministic models cannot fully capture the uncertainty inherent in private market investing. Cash flows occur irregularly, exit timing varies, valuations evolve under changing market conditions, and portfolio companies respond differently to economic cycles. Consequently, long-term investment outcomes are better represented as probability distributions than fixed point estimates.
The Alts Custodian Monte Carlo Framework extends deterministic portfolio analysis by replacing static assumptions with calibrated probability distributions derived from historical observations, portfolio behavior, and market dynamics. Rather than forecasting one future, the framework evaluates thousands of plausible portfolio paths, allowing investors to assess expected return, downside risk, recovery potential, and wealth accumulation under a broad range of economic environments. The objective is not prediction, but quantification of uncertainty.
8.1 Return Distributions
Expected return represents only the center of a much broader distribution of possible outcomes. Portfolio performance is influenced not only by average growth but also by the variability, asymmetry, and tail behavior of returns. Modeling these characteristics explicitly enables the simulation framework to capture both ordinary market fluctuations and less frequent but economically significant events that shape long-term investor experience.
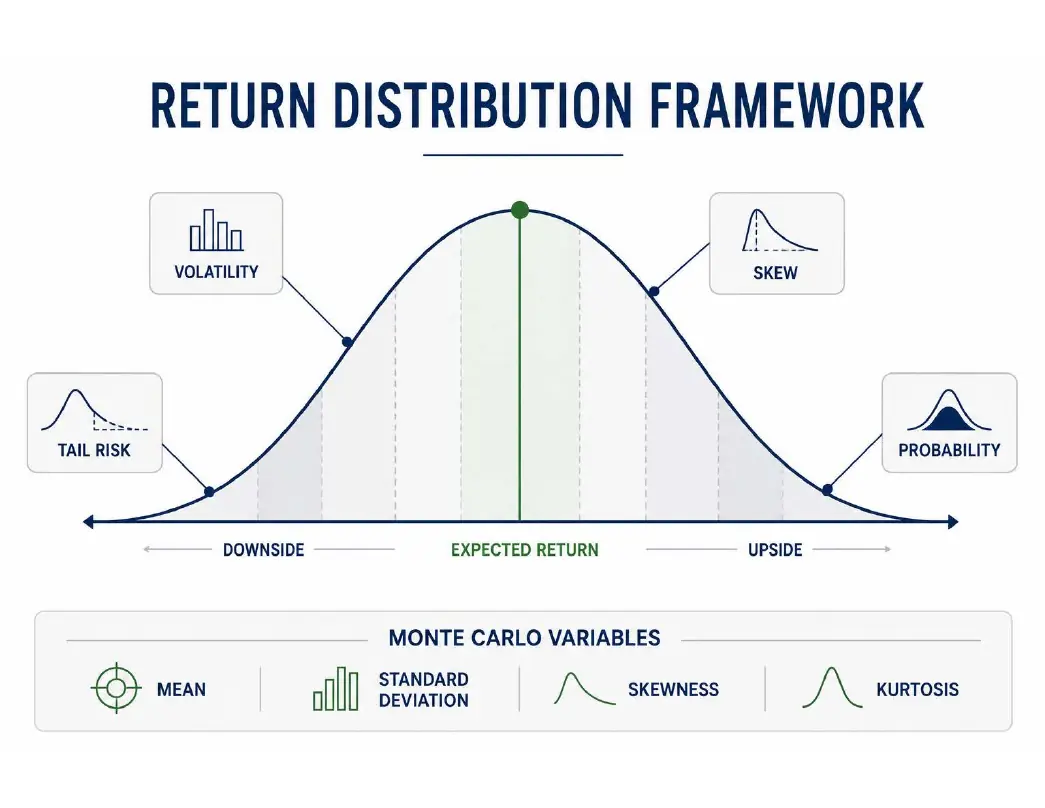
Portfolio Interpretation
Two investments with identical expected compound returns may generate materially different long-term outcomes if one exhibits greater volatility, negative skewness, or increased exposure to extreme downside events. Modeling the complete return distribution therefore provides a more realistic representation of investment uncertainty than relying upon a single expected return estimate.
Monte Carlo Variables
| Variable | Engine Input |
|---|---|
| Expected CAGR | Mean |
| Volatility | Standard Deviation |
| Skew | Skewness |
| Tail Risk | Kurtosis |
Modeling Implications
- Replace deterministic return assumptions with probability distributions.
- Capture asymmetric outcomes through skewness.
- Model extreme events using fat-tail behavior rather than normal distributions.
8.2 Portfolio Dynamics
Investment outcomes evolve through time rather than as isolated annual observations. Market environments frequently persist across multiple periods, producing prolonged expansions, recessions, and recoveries that materially influence cumulative portfolio performance. Modeling temporal dependence allows the simulation framework to reproduce more realistic patterns of drawdowns and recoveries.
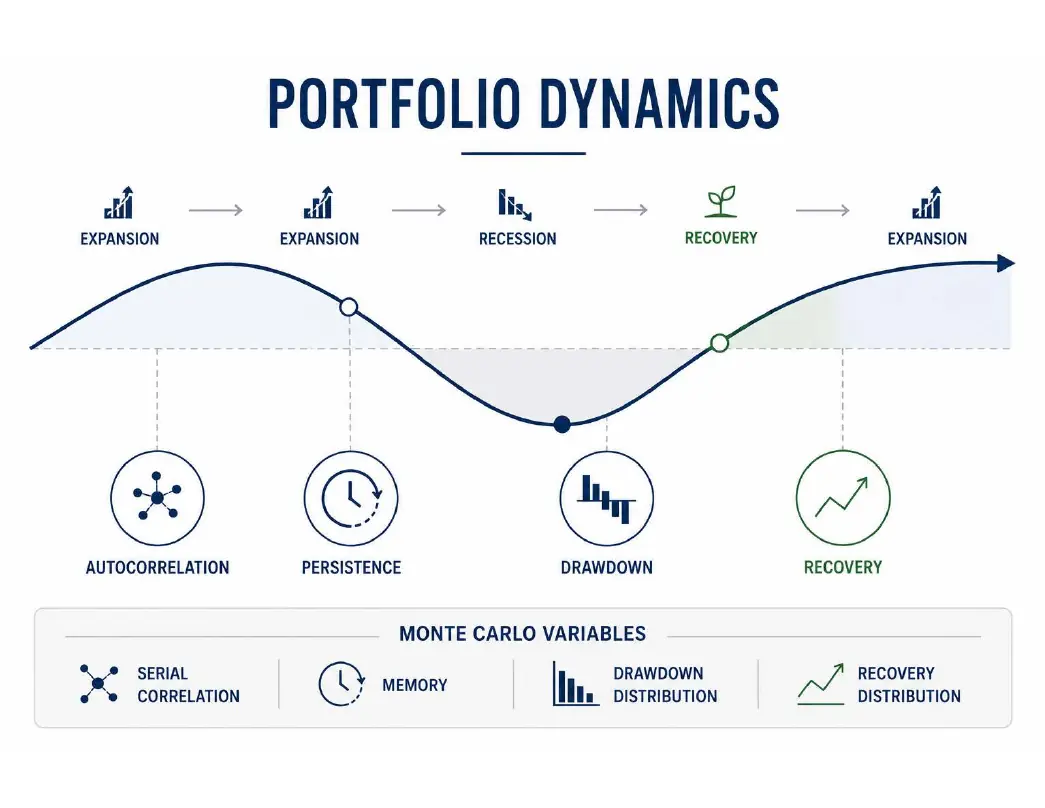
Portfolio Interpretation
Ignoring serial dependence tends to underestimate both prolonged market stress and sustained recovery periods. Incorporating autocorrelation, recovery distributions, and drawdown characteristics produces simulations that more accurately reflect the observed behavior of long-term private market portfolios.
Monte Carlo Variables
| Variable | Engine Input |
|---|---|
| Autocorrelation | Serial Correlation |
| Persistence | Memory Coefficient |
| Drawdown | Downside Distribution |
| Recovery | Recovery Distribution |
Modeling Implications
- Preserve temporal dependence across simulation periods.
- Model recovery separately from initial losses.
- Represent market regimes as persistent rather than independent events.
8.3 Investment Uncertainty
Private market investing introduces uncertainty beyond return variability alone. Exit timing, distribution timing, transaction pricing, manager performance, and valuation adjustments each influence investment outcomes through independent mechanisms. Separating these uncertainty sources enables the simulation engine to evaluate their individual contribution before integrating them into complete portfolio scenarios.
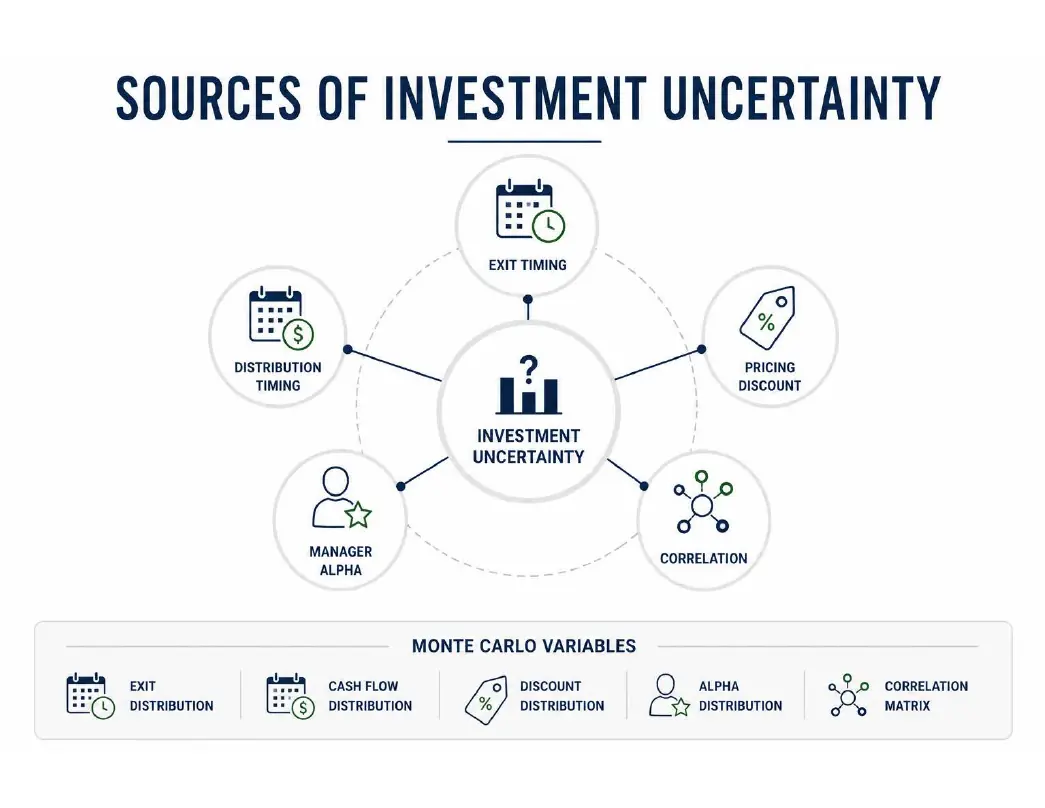
Portfolio Interpretation
Each uncertainty source contributes differently to overall portfolio behavior. Modeling these variables independently allows the framework to distinguish between market-driven uncertainty and investment-specific uncertainty while preserving the interaction between the two.
Monte Carlo Variables
| Variable | Engine Input |
|---|---|
| Exit Timing | Exit Distribution |
| Distribution Timing | Cash Flow Distribution |
| Pricing Discount | Discount Distribution |
| Manager Alpha | Alpha Distribution |
| Correlation | Correlation Matrix |
Modeling Implications
- Separate market uncertainty from investment-specific uncertainty.
- Model timing variables as stochastic distributions.
- Preserve diversification effects through dynamic correlation.
8.4 Monte Carlo Engine
The Monte Carlo Engine represents the culmination of the portfolio construction methodology developed throughout this paper. Investment characteristics, cash flow behavior, portfolio variables, structural resilience assumptions, and probability distributions are integrated into a unified simulation framework capable of evaluating thousands of independent portfolio paths. Each simulation represents one plausible future, collectively producing a probability distribution of long-term portfolio outcomes rather than a single forecast.
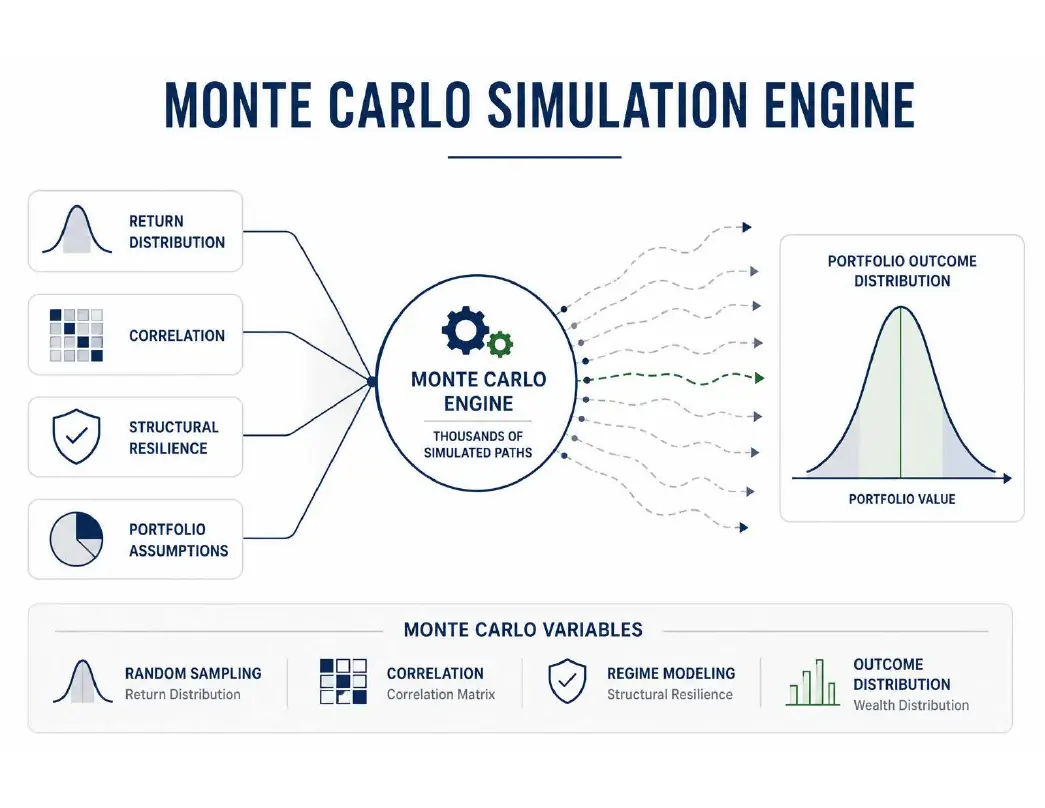
Portfolio Interpretation
Rather than predicting a single outcome, the Monte Carlo Engine quantifies the probability of many possible outcomes. This approach enables investors to evaluate expected performance alongside downside risk, recovery potential, capital preservation, and long-term wealth accumulation within a consistent probabilistic framework.
Monte Carlo Variables
| Variable | Engine Input |
|---|---|
| Return Distribution | Random Sampling |
| Correlation | Correlation Matrix |
| Structural Resilience | Regime Variables |
| Portfolio Outcome | Wealth Distribution |
Modeling Implications
- Integrate deterministic assumptions with probabilistic simulation.
- Evaluate complete outcome distributions rather than point estimates.
- Produce transparent, repeatable, and scenario-consistent portfolio projections.
Chapter 8 Summary
The Monte Carlo Framework represents the final stage of the Alts Custodian quantitative methodology. Investment characteristics, cash flow mechanics, portfolio variables, risk factors, structural resilience assumptions, and probability distributions are integrated within a unified probabilistic framework that evaluates thousands of plausible portfolio outcomes rather than relying upon a single expected forecast.
By replacing deterministic assumptions with calibrated probability distributions, the framework provides a more realistic representation of long-term investment uncertainty while maintaining consistency across portfolio construction, stress testing, scenario analysis, and Monte Carlo simulation. The result is a transparent, repeatable, and institutionally robust methodology that supports investment decisions under both expected and adverse market conditions.
Chapter 9. Due Diligence Framework
A Quantitative Assessment Methodology for Private Equity Secondaries
Chapter Introduction
Successful portfolio construction begins with disciplined investment selection. While the preceding chapters established a quantitative framework for evaluating return characteristics, cash flow behavior, portfolio resilience, and uncertainty, the quality of those outcomes ultimately depends upon the capabilities of the investment manager. Manager selection therefore represents one of the most significant determinants of long-term investment success.
Traditional due diligence often relies upon qualitative observations and subjective judgments. Although experienced investors naturally incorporate these considerations into their decision-making process, the absence of a structured methodology frequently leads to inconsistent assessments across investment opportunities. Institutional portfolio construction requires a repeatable framework that evaluates managers using transparent criteria supported by observable evidence.
The Alts Custodian Due Diligence Framework transforms qualitative observations into standardized assessment scores by evaluating investment platforms, portfolio construction practices, governance, operational capabilities, and manager alignment. Each assessment is supported by documented evidence, assigned an appropriate weight, accompanied by a confidence rating, and incorporated into a unified Due Diligence Engine that enables consistent comparison across investment opportunities.
9.1 Investment Platform
The quality of an investment platform establishes the foundation upon which long-term investment performance is built. Beyond historical returns, institutional investors evaluate whether the manager possesses a disciplined investment process, an experienced organization, and a sufficiently broad network to originate attractive transactions under varying market conditions. These characteristics determine the manager's ability to source proprietary opportunities, conduct effective due diligence, and maintain investment discipline throughout changing economic environments.
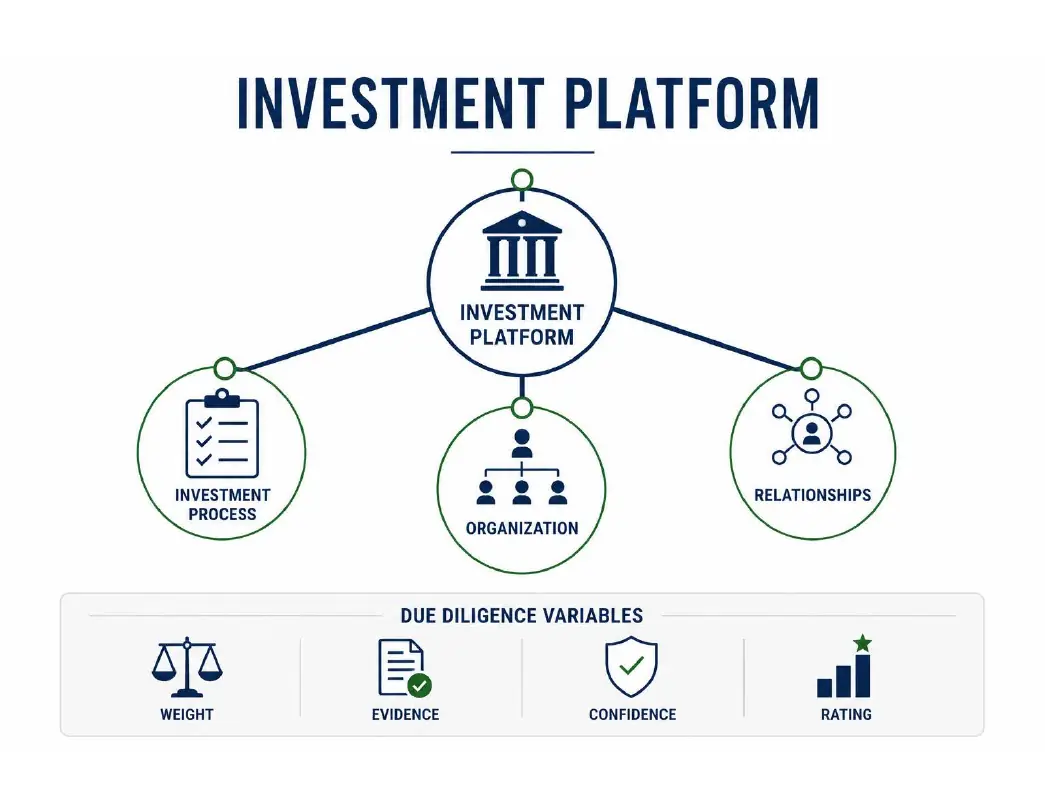
Assessment Areas
| Dimension | Primary Evaluation |
|---|---|
| Investment Process | Discipline and repeatability |
| Organization | Experience and institutional capability |
| Relationships | Proprietary sourcing and market access |
Evaluation
A strong investment platform demonstrates repeatable decision-making supported by experienced professionals, institutional infrastructure, and differentiated sourcing capabilities. These characteristics improve the probability of consistently identifying attractive investment opportunities while reducing execution risk across multiple market cycles.
Due Diligence Variables
| Variable | Purpose |
|---|---|
| Weight | Relative importance |
| Evidence | Supporting documentation |
| Confidence | Reliability of assessment |
| Rating | Quantitative score |
9.2 Portfolio Construction
Portfolio construction quality reflects the manager's ability to allocate capital efficiently while maintaining appropriate diversification, valuation discipline, liquidity management, and investor economics. Superior managers recognize that long-term performance depends not only upon selecting attractive investments but also upon constructing resilient portfolios capable of performing across varying market environments.

Assessment Areas
| Dimension | Primary Evaluation |
|---|---|
| Pricing | Valuation discipline |
| Portfolio Construction | Diversification methodology |
| Liquidity | Portfolio flexibility |
| Fee Structure | Investor alignment |
Evaluation
Institutional portfolio construction balances return generation with diversification, liquidity, and valuation discipline. Managers demonstrating consistent portfolio construction practices are generally better positioned to maintain investment performance throughout changing market environments.
Due Diligence Variables
| Variable | Purpose |
|---|---|
| Weight | Relative importance |
| Evidence | Supporting documentation |
| Confidence | Reliability of assessment |
| Rating | Quantitative score |
9.3 Governance & Operations
Governance and operational capabilities represent essential components of institutional investment management. Effective governance promotes disciplined decision-making and investor protection, while robust operational infrastructure supports accurate reporting, regulatory compliance, transaction execution, and portfolio administration. Although these characteristics may not directly increase returns, they materially reduce operational and execution risk.
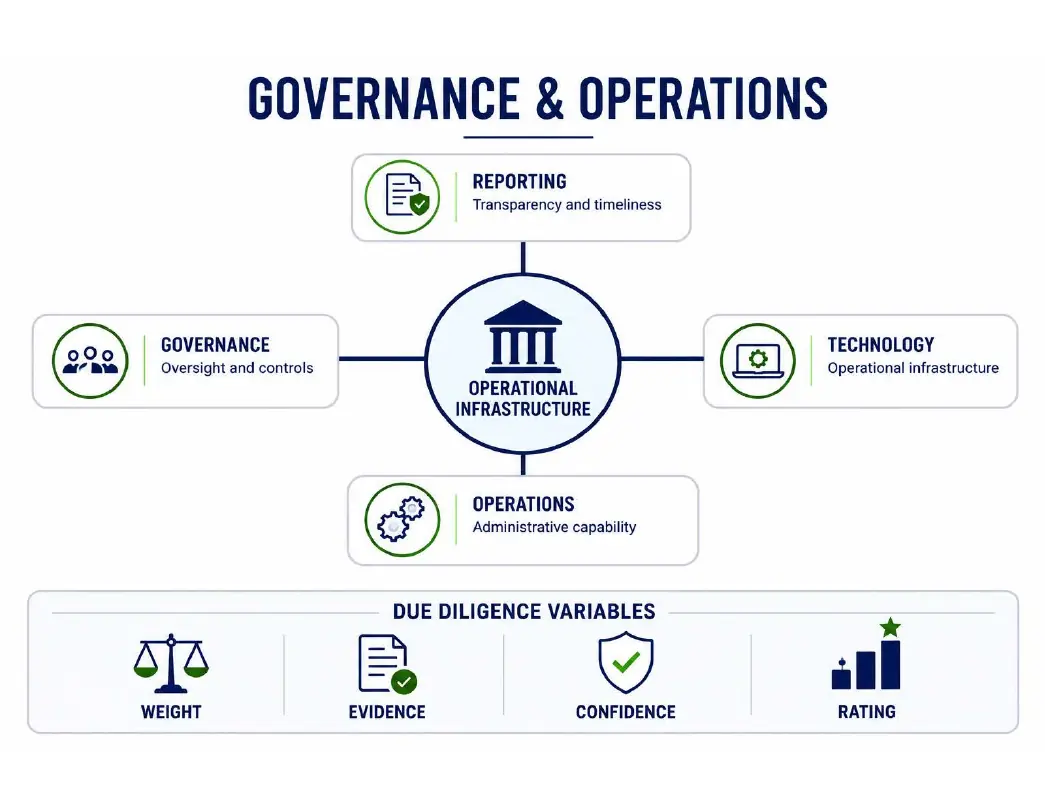
Assessment Areas
| Dimension | Primary Evaluation |
|---|---|
| Governance | Oversight and controls |
| Operations | Administrative capability |
| Reporting | Transparency and timeliness |
| Technology | Operational infrastructure |
Evaluation
Managers supported by strong governance frameworks and institutional operational processes generally demonstrate lower execution risk, improved transparency, and greater consistency throughout the investment lifecycle.
Due Diligence Variables
| Variable | Purpose |
|---|---|
| Weight | Relative importance |
| Evidence | Supporting documentation |
| Confidence | Reliability of assessment |
| Rating | Quantitative score |
9.4 Manager Alignment
Manager alignment evaluates the consistency between the interests of the investment manager and those of the investor. Historical execution, alignment of incentives, organizational stability, and responsible stewardship collectively provide evidence regarding the manager's long-term commitment to preserving investor capital while generating sustainable investment performance.
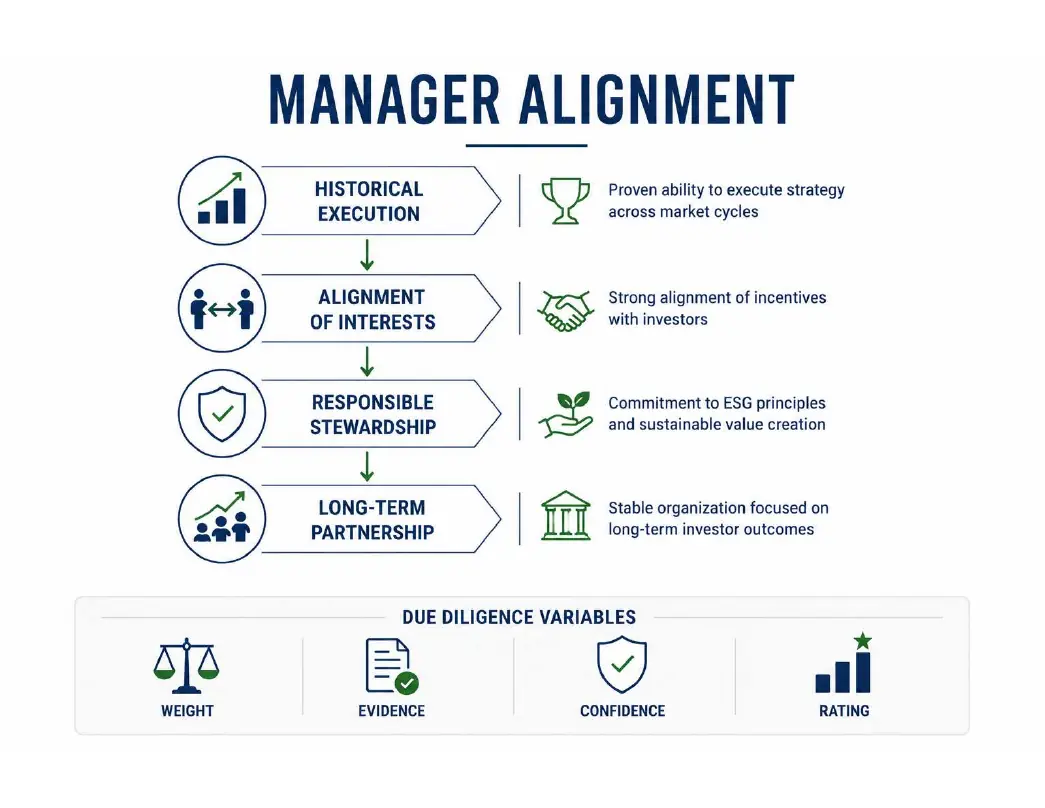
Assessment Areas
| Dimension | Primary Evaluation |
|---|---|
| Historical Execution | Multi-cycle performance |
| Alignment | Investor and GP interests |
| ESG | Responsible investment practices |
| Organizational Stability | Long-term continuity |
Evaluation
Managers demonstrating strong alignment and consistent execution across multiple market environments provide greater confidence that investment decisions remain focused upon long-term value creation rather than short-term performance objectives.
Due Diligence Variables
| Variable | Purpose |
|---|---|
| Weight | Relative importance |
| Evidence | Supporting documentation |
| Confidence | Reliability of assessment |
| Rating | Quantitative score |
9.5 Due Diligence Engine
Individual due diligence observations become significantly more valuable when evaluated within a consistent analytical framework. Rather than relying upon isolated qualitative judgments, the Due Diligence Engine aggregates standardized assessments across multiple dimensions into a unified institutional evaluation methodology. This approach enables investment opportunities to be compared consistently while preserving transparency regarding the evidence supporting each conclusion.
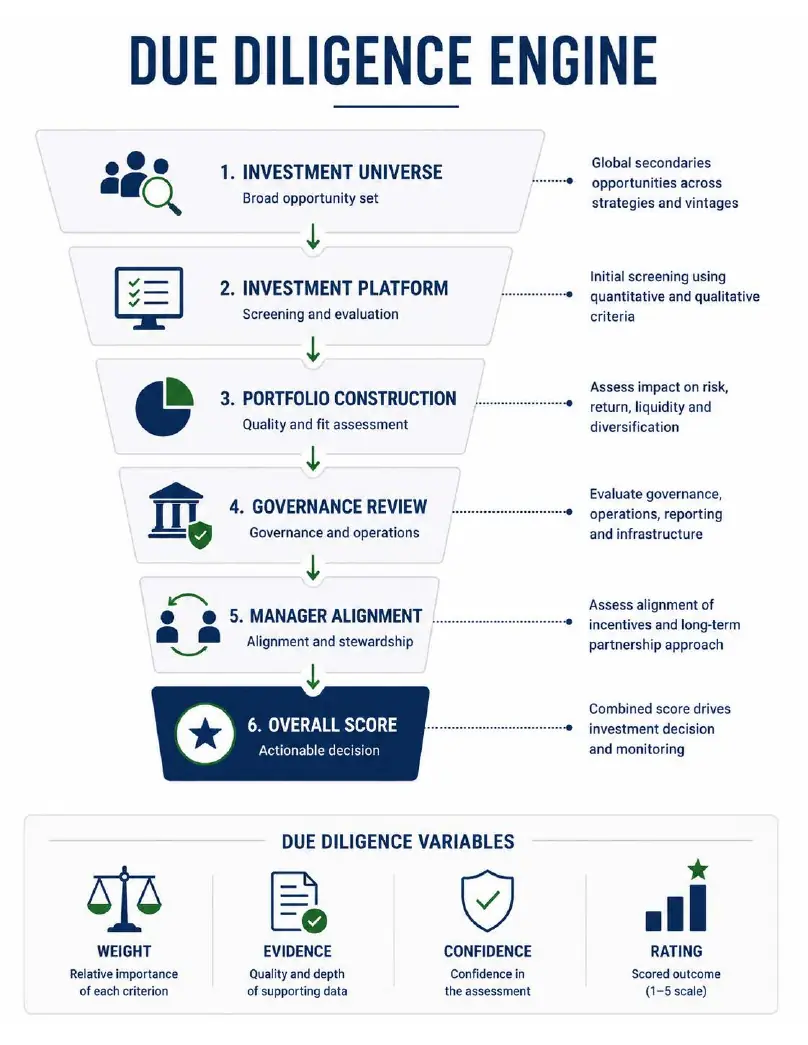
Evaluation
The Due Diligence Engine represents the final stage of manager assessment. Every observation collected throughout the due diligence process contributes to a standardized score reflecting both the quality of the manager and the confidence associated with the assessment. This methodology enables qualitative investment research to become directly comparable across investment opportunities while supporting portfolio construction decisions through measurable evaluation criteria.
Due Diligence Variables
| Variable | Purpose |
|---|---|
| Weight | Relative importance of each assessment category |
| Evidence | Strength of supporting documentation |
| Confidence | Reliability and completeness of available information |
| Rating | Standardized quantitative assessment |
Chapter 9 Summary
Institutional due diligence extends beyond evaluating historical performance. A comprehensive assessment must consider the quality of the investment platform, portfolio construction methodology, governance framework, operational capabilities, and manager alignment to determine the long-term sustainability of investment performance. By evaluating these dimensions systematically, investors obtain a more complete understanding of both manager capability and investment quality.
The Alts Custodian Due Diligence Framework transforms qualitative observations into standardized assessment variables supported by documented evidence, confidence ratings, and weighted evaluation criteria. This methodology creates a transparent and repeatable investment selection process while providing direct inputs for portfolio construction and manager comparison.
Unlike traditional due diligence checklists, the framework explicitly incorporates confidence alongside rating. Two managers may receive similar assessment scores while differing substantially in the quality of supporting evidence. By measuring not only how a manager is evaluated but also how confident the evaluator can be in that conclusion, the Due Diligence Engine introduces an additional layer of analytical rigor that supports more informed investment decisions under conditions of incomplete information.
Chapter 10. Fund Modeling Framework
A Case Study: Pomona Investment Fund
Chapter Introduction
The analytical framework presented throughout this white paper is intended to support disciplined evaluation and portfolio modeling of private equity secondary investments. The preceding chapters established methodologies for understanding asset characteristics, return drivers, cash flow behavior, portfolio resilience, risk assessment, manager due diligence, and probabilistic analysis. The final step is to translate these methodologies into a standardized set of modeling assumptions for an individual investment vehicle.
This chapter demonstrates that process using the Pomona Investment Fund as an illustrative case study. Rather than attempting to forecast future performance with certainty, the objective is to develop a transparent, evidence-based representation of expected investment behavior that can be integrated into portfolio construction, deterministic projections, stress testing, and Monte Carlo simulation. Every modeling assumption should be supported by documented evidence, assigned an appropriate confidence level, and reviewed periodically as new information becomes available.
10.1 Modeling Assumptions
The foundation of every portfolio model is a standardized set of assumptions describing expected performance, cash flow characteristics, portfolio behavior, and investment risk. These assumptions provide the quantitative inputs required to evaluate how an investment is expected to behave under both normal and stressed market environments. Standardization also ensures that different investment opportunities can be compared consistently within the same analytical framework.
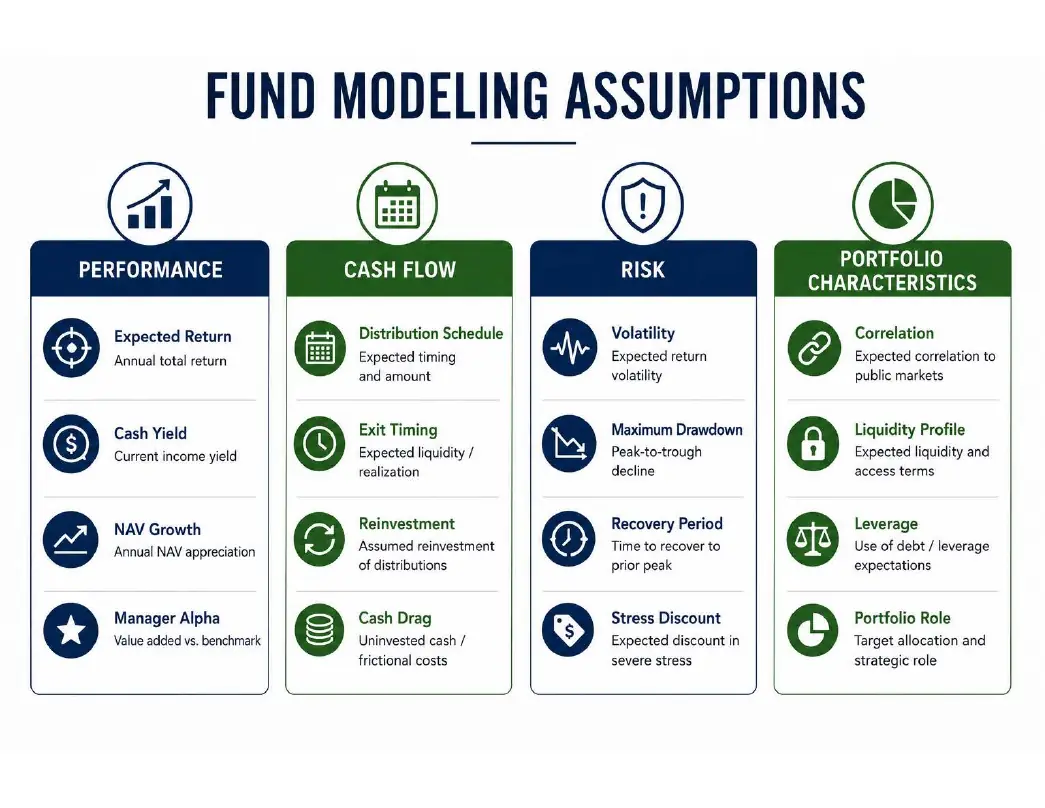
For the Pomona Investment Fund, the primary modeling assumptions are organized into four categories.
Performance Assumptions
Performance assumptions describe the expected long-term value creation generated by the investment.
Typical inputs include:
- Expected annual return
- Expected cash yield
- Expected NAV growth
- Expected manager alpha
These variables establish the baseline return expectations used throughout deterministic and probabilistic portfolio projections.
Cash Flow Assumptions
Cash flow assumptions describe the timing and magnitude of investor cash movements throughout the investment lifecycle.
Typical inputs include:
- Expected distribution schedule
- Expected exit timing
- Reinvestment assumptions
- Cash drag assumptions
These variables determine how capital is deployed, distributed, and subsequently reinvested within the broader portfolio.
Risk Assumptions
Risk assumptions define expected investment behavior during adverse market environments.
Typical inputs include:
- Expected volatility
- Expected maximum drawdown
- Expected recovery period
- Expected stress discount
These assumptions support structural resilience analysis and Monte Carlo simulation by describing downside characteristics rather than relying solely on historical return observations.
Portfolio Characteristics
Portfolio characteristics define how the investment interacts with the remainder of a diversified portfolio.
Typical inputs include:
- Expected correlation
- Liquidity profile
- Leverage characteristics
- Portfolio allocation constraints
These variables determine the diversification benefits and overall contribution of the investment within a multi-asset portfolio.
10.2 Assumption Governance
Reliable portfolio modeling depends not only upon selecting appropriate assumptions but also upon maintaining a transparent governance framework for every modeled variable. Each assumption should therefore be documented with supporting evidence, reviewed periodically, and assigned a confidence level reflecting the quality of available information. This governance process improves consistency across investment analyses while providing a clear audit trail for future updates.

Every modeling assumption is accompanied by a standardized governance record consisting of the following elements.
| Attribute | Purpose |
|---|---|
| Source | Primary reference supporting the assumption |
| Confidence | Reliability of available evidence |
| Override Allowed | Indicates whether analyst judgment may replace the default assumption |
| Last Updated | Most recent review date |
The governance framework distinguishes between assumptions derived directly from fund documentation and those estimated using broader market evidence or analytical methodologies. This distinction provides transparency regarding the origin of each input and supports informed interpretation of model results.
Because private market investments evolve over time, assumptions should be reviewed periodically as updated financial reports, portfolio disclosures, market conditions, and manager communications become available. A structured governance process ensures that the investment model remains current while preserving consistency across successive revisions.
10.3 Integrated Fund Model
The standardized assumptions developed for the Pomona Investment Fund become direct inputs into the portfolio modeling framework presented throughout this white paper. Rather than functioning independently, each assumption contributes to multiple analytical components that collectively evaluate expected investment behavior under a range of market conditions.
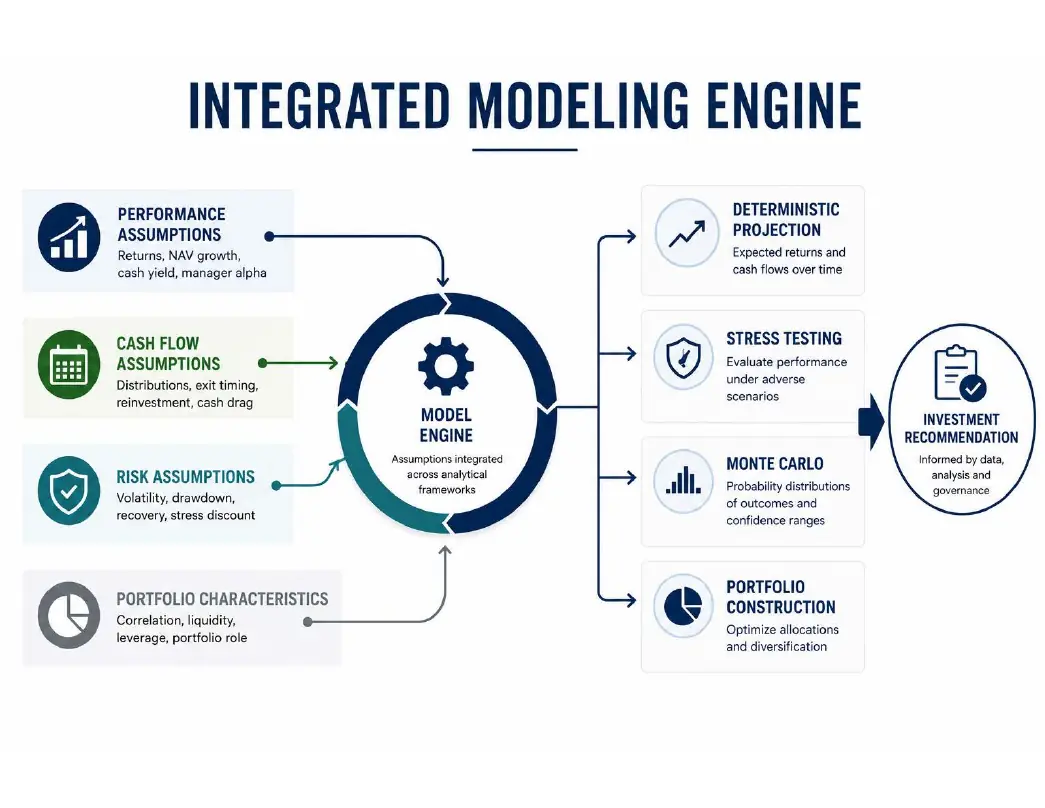
Performance assumptions establish the expected return profile used in deterministic portfolio projections. Cash flow assumptions determine the timing of capital deployment, distributions, and reinvestment. Risk assumptions support stress testing and probabilistic simulation by describing downside behavior and recovery characteristics. Portfolio characteristics define the interaction between the investment and the broader allocation through correlation, liquidity, and diversification effects.
Integrating these assumptions within a unified analytical framework enables consistent evaluation across different investment opportunities while preserving flexibility for scenario analysis and sensitivity testing. As new information becomes available, individual assumptions can be updated without altering the underlying modeling methodology, ensuring both adaptability and methodological consistency.
Chapter 10 Summary
The purpose of fund modeling is not to predict future performance with certainty but to construct a transparent, evidence-based representation of expected investment behavior. By organizing assumptions into standardized categories covering performance, cash flows, risk, and portfolio characteristics, investment opportunities can be evaluated consistently across deterministic projections, stress testing, and probabilistic simulations.
Using the Pomona Investment Fund as an illustrative case study demonstrates how qualitative research and quantitative analysis can be integrated into a repeatable modeling framework. Each assumption is supported by documented sources, governed through a structured review process, and accompanied by confidence assessments that acknowledge the inherent uncertainty of private markets. This approach transforms investment research into a disciplined analytical methodology capable of supporting informed portfolio construction and ongoing investment oversight.
Conclusion
Toward a More Disciplined Framework for Private Equity Secondaries
Private equity secondaries have evolved from a niche liquidity solution into a mature segment of the private markets. Increasing transaction volumes, expanding participation by institutional investors, and the continued development of specialized secondary strategies have transformed the asset class into an increasingly important component of long-term portfolio construction. As the market continues to mature, investment decisions must be supported by analytical frameworks that extend beyond historical performance and qualitative manager selection.
This white paper presented a structured methodology for evaluating private equity secondaries from multiple perspectives. Beginning with the evolution of the market and the mechanics of secondary transactions, the framework examined the fundamental sources of return, investment cash flows, portfolio characteristics, risk factors, manager assessment, and quantitative modeling techniques. Collectively, these elements provide a consistent foundation for understanding how secondary investments may contribute to diversified investment portfolios.
A central theme throughout this research is that investment evaluation should be evidence-based, transparent, and repeatable. Every assumption should be supported by documented sources, every qualitative assessment should be translated into standardized evaluation criteria, and every modeling input should be governed through a structured review process. While uncertainty cannot be eliminated from private markets, it can be explicitly recognized, measured, and incorporated into the investment decision-making process.
The framework also emphasizes the importance of integrating qualitative research with quantitative analysis. Manager due diligence, portfolio construction, stress testing, deterministic projections, and Monte Carlo simulation should not be viewed as independent exercises, but as complementary components of a unified analytical process. When combined, these disciplines provide a more comprehensive understanding of both expected investment behavior and the range of potential outcomes across changing market environments.
Although this paper illustrates the methodology through the Pomona Investment Fund, the framework is intentionally investment-agnostic. The same principles can be applied to other private equity secondary funds, continuation vehicles, GP-led transactions, LP portfolios, and related private market investments. As additional research, market data, and manager information become available, individual assumptions may be refined without altering the underlying methodology.
Ultimately, successful portfolio construction depends not only on selecting attractive investments, but on evaluating those investments consistently, documenting the assumptions that support them, and understanding how they interact within the broader portfolio. The continued maturation of private equity secondaries presents new opportunities for institutional and wealth management investors alike, while simultaneously increasing the need for disciplined, transparent, and repeatable analytical frameworks.
The methodology presented in this white paper is intended to serve as a practical foundation for that process. By combining institutional research, standardized due diligence, structured assumption governance, and quantitative portfolio modeling, investors can evaluate private equity secondaries with greater consistency, improved transparency, and a clearer understanding of both expected outcomes and the uncertainty that accompanies long-term private market investing.
Final Closing Statement
As private markets continue to expand within institutional and wealth management portfolios, the ability to evaluate investments through disciplined, evidence-based methodologies will become increasingly important. Private equity secondaries represent more than a source of liquidity or portfolio optimization—they illustrate the broader transition of private markets toward greater transparency, analytical rigor, and integration within modern portfolio construction. The framework presented in this paper is intended to support that transition by providing a practical, repeatable methodology that bridges investment research, due diligence, and portfolio implementation. It is designed not only to inform individual investment decisions, but also to establish a foundation that can evolve alongside the private markets themselves.