1. Foundational Framework of Ground Leases
1.1 Overview
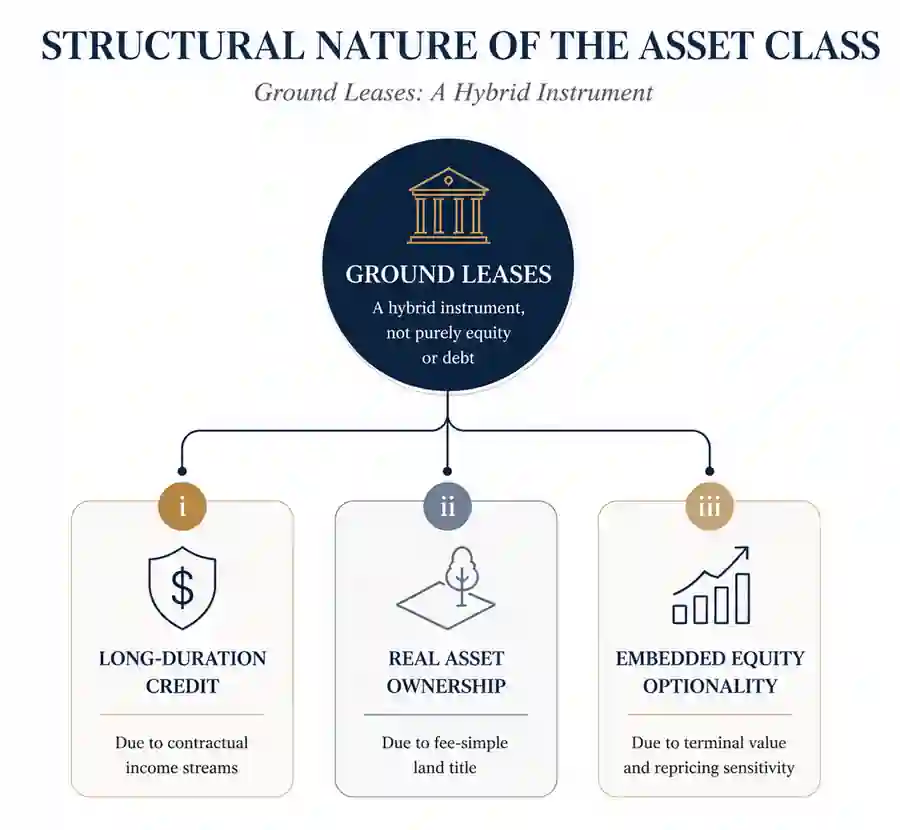
Real estate ground leases, also referred to as real estate royalties, represent a structurally senior, long-duration real asset class that transforms fee-simple land ownership into a contractual income-producing instrument backed by underlying real estate value.
At its core, the asset class sits at the intersection of real estate ownership, long-duration credit, inflation-linked cash flow structures, and cyclical capital market inefficiencies.
The investment opportunity is defined by two reinforcing macroeconomic forces: capital scarcity in real estate financing markets and long-term repricing of real estate assets driven by interest rate cycles. Together, these create a dual-engine return structure combining origination yield enhancement with long-duration valuation optionality.
1.2 Core Investment Thesis
The fundamental thesis is that ground leases provide investors with structurally senior exposure to real estate cash flows, while preserving embedded land ownership rights that capture long-term asset appreciation and capital structure stress optionality.
Structural Seniority of Land Ownership
Ground leases represent fee-simple ownership of land, the ultimate underlying collateral in real estate. Unlike traditional debt or equity claims tied to the operating building, ground lease ownership sits at the legal foundation of real estate title, survives leasehold-level financial distress, and maintains claim over the underlying land asset across the full lease duration.
Contractual, Inflation-Linked Income Stream
Ground leases generate long-duration contractual cash flows, typically characterized by 50-99 year lease terms, fixed base rent with embedded annual escalations, periodic CPI-based rent resets at 5-10 year intervals, and low correlation to short-term occupancy volatility.
Embedded Long-Term Real Asset Optionality
Beyond contractual income, ground leases include a long-dated embedded option on real estate appreciation through land value appreciation over time, cap rate compression cycles, and eventual reversion of leasehold improvements at lease maturity.
1.3 Macro Regime Context
The current investment opportunity is driven by elevated interest rates, CRE refinancing constraints, and reduced bank lending capacity. These conditions increase discount rates, reduce traditional debt availability, and force property owners to seek alternative capital structures.
A structural financing gap has emerged between property owners requiring capital and traditional lenders unwilling or unable to provide it. Ground leases emerge as a capital solution within this gap, providing stable, long-duration, structurally senior investment opportunities.
2. Two-Engine Opportunity Model
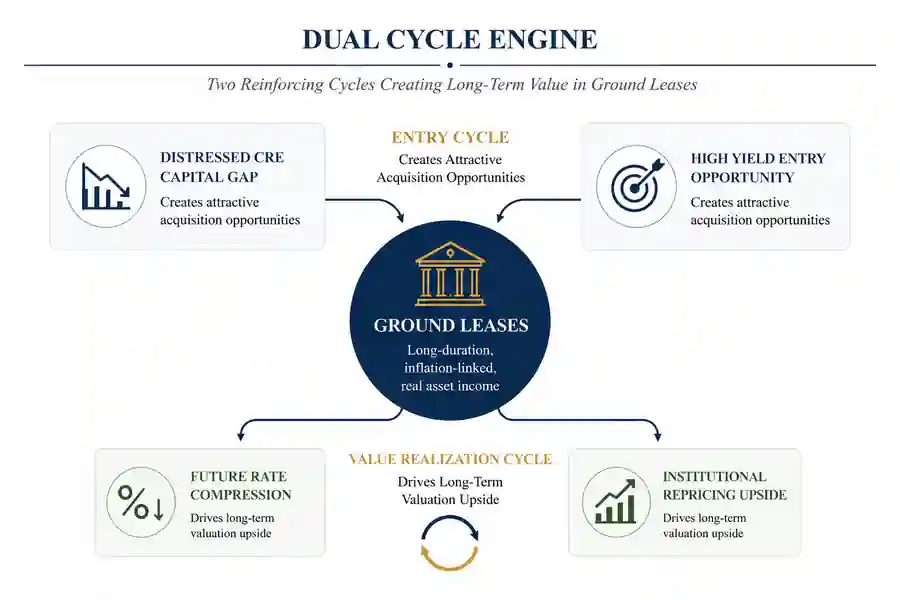
The investment potential of real estate ground leases emerges from the interaction of two independent but reinforcing forces. Together, they define both the entry dynamics and the long-term value creation profile of the asset class.
2.1 Engine 1 - Distressed Capital Formation (Origination Alpha)
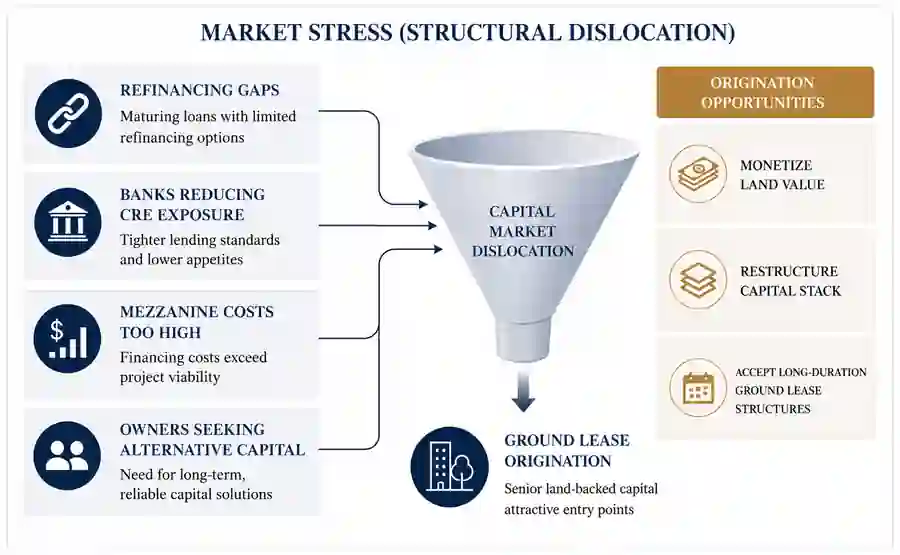
The first driver reflects structural dislocations in commercial real estate capital markets. Developers and property owners are constrained by refinancing gaps, reduced bank lending, and elevated mezzanine financing costs. As a result, they face limited traditional options to fund construction, refinance maturing debt, or restructure their capital stacks.
- Developers face refinancing gaps
- Banks reduce CRE exposure
- Mezzanine debt costs exceed project viability thresholds
- Owners seek alternative sources of long-term capital
Property owners in this environment are increasingly willing to monetize underlying land value, restructure their capital stack, and accept long-duration ground lease structures.
From an economic perspective, ground leases function as non-bank, senior land-backed financing replacing impaired parts of CRE credit markets.
2.2 Engine 2 - Interest Rate / Valuation Cycle (Return Alpha)
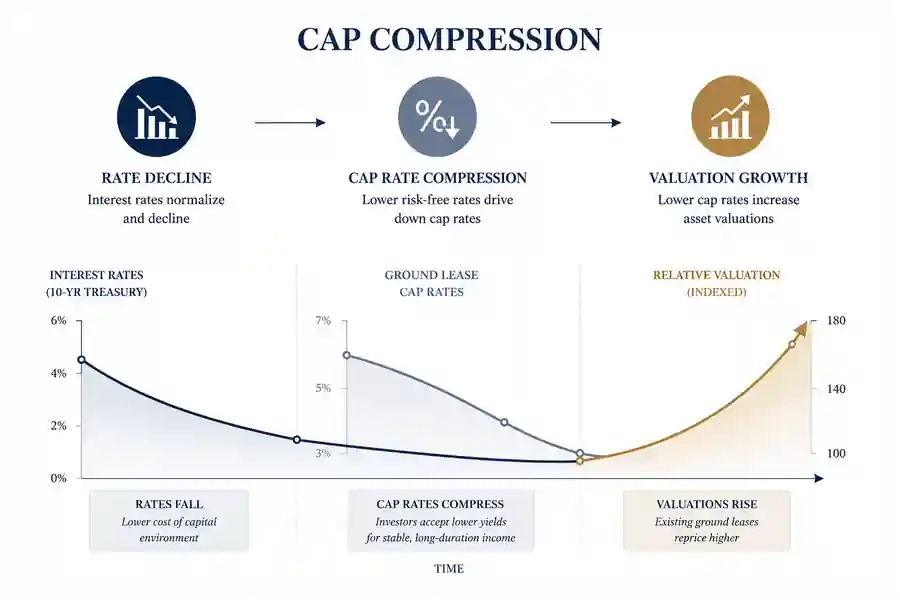
The second driver is macro-driven, reflecting the long-term impact of interest rate normalization and capital market repricing on ground lease valuations. Long-duration ground lease income streams are sensitive to rate shifts; as rates decline, cap rate compression and repricing of institutional-grade assets can generate value expansion.
2.3 Integrated Two-Engine View
The two engines combine to create a dual-source return model: origination alpha from distressed capital dislocation and return alpha from long-term repricing and cap rate compression beyond contractual cash flows.
3. Structural Position and Capital Stack
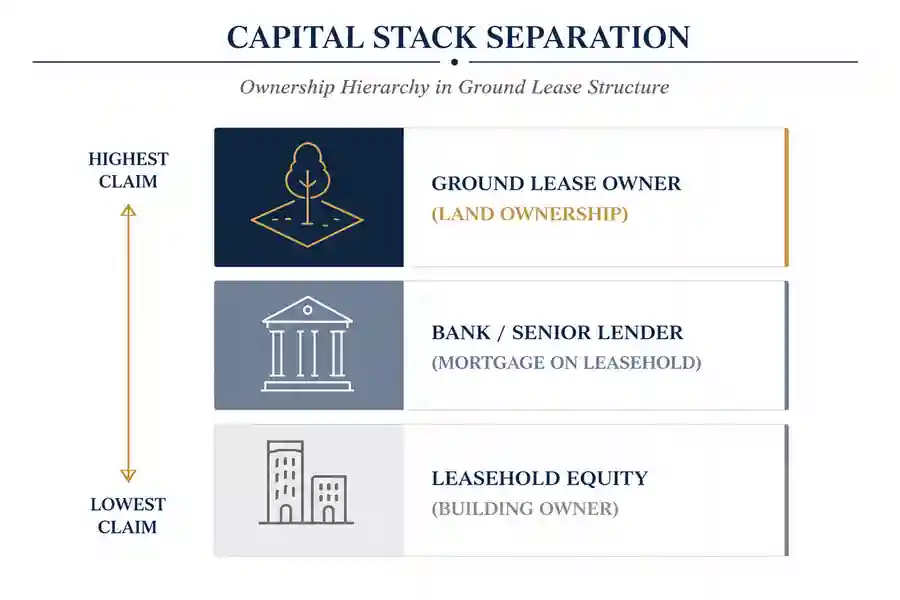
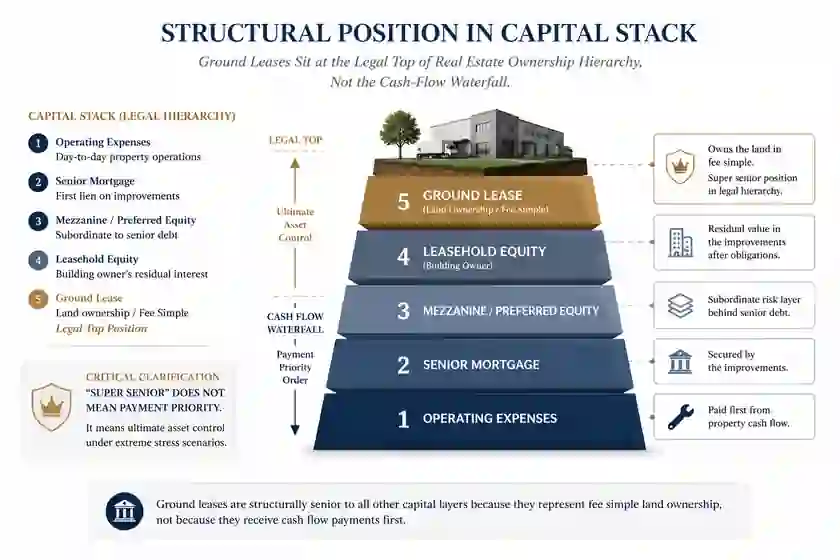
Ground leases occupy a unique position in the legal hierarchy of real estate ownership. Their seniority is not defined by cash-flow priority, but by legal control of the underlying land itself.
The capital stack for a typical ground lease investment can be described as operating expenses, senior mortgage, mezzanine or preferred equity, leasehold equity, and ground lease fee-simple land ownership.
A critical clarification is required: the term super senior does not imply first-in-line for cash flows. Instead, it reflects durability of the asset claim. In extreme financial distress, ground lease owners retain control over the underlying land and can enforce lease terms or reclaim ownership, even if other leasehold claims fail.
4. Market Structure and Size
Ground leases exist as a hidden but structurally important layer within the broader U.S. real estate market. While total real estate values are enormous, the investable portion represented by structured ground lease or real estate royalty investments is far smaller and targeted toward institutional investors and sophisticated private capital.
4.1 Structural Market Reality
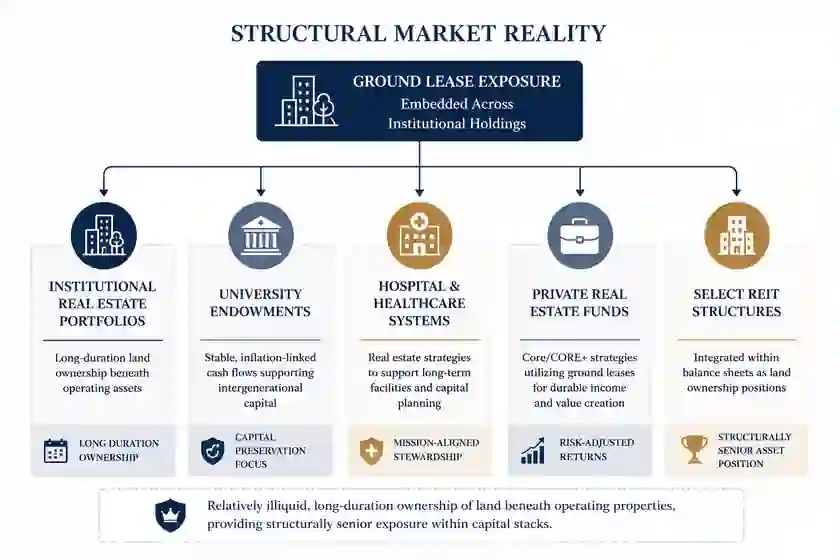
Ground lease exposure is embedded across institutional real estate portfolios, university endowments, hospital and healthcare systems, private real estate funds, and select REIT structures. These positions often represent long-duration, low-turnover ownership of land beneath operating properties.
4.2 Market Sizing Logic
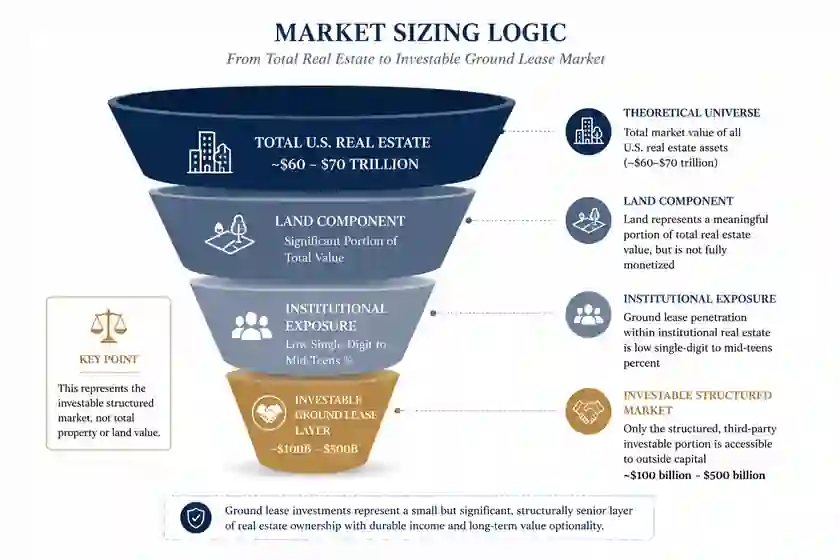
Rather than a single, well-defined market, ground leases exist as a hidden layer of ownership within real estate assets. Estimating the investable market requires separating underlying property value from the portion that can be monetized through structured ground lease instruments.
- Total U.S. real estate: approximately $60-70 trillion
- Land component: significant but unevenly monetized
- Ground lease penetration in institutional assets: low single-digit to mid-teens percent
- Investable structured market estimate: approximately $100 billion to $500 billion
This estimate excludes total property value and reflects only assets structured for entry by outside capital.
4.3 Public Market Anchor
The U.S. public market has only one scaled pure-play ground lease REIT, Safehold (NYSE: SAFE). Safehold serves as a partial benchmark for institutional investors and illustrates the potential yield and risk profile, but it is not fully representative of the private market.
5. Product Structure: Real Estate Royalties
5.1 Overview
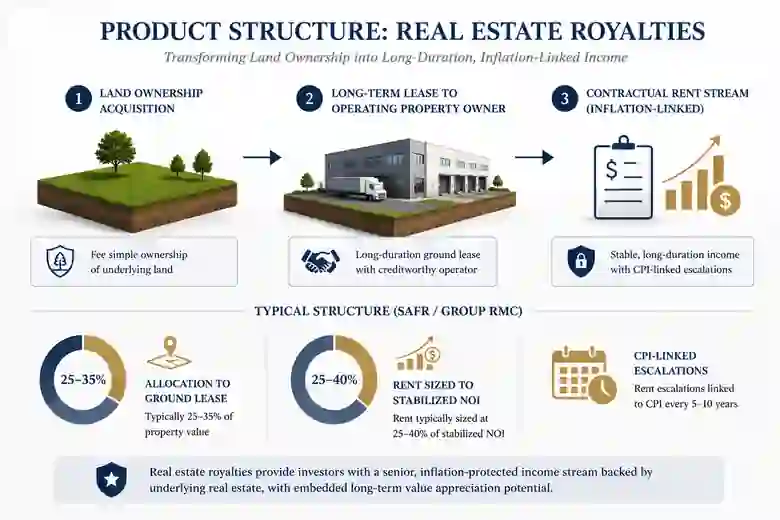
Ground lease investments, often branded as real estate royalties, are structured to combine land ownership with long-term contractual cash flows from the operating property. They function as a hybrid instrument delivering income stability, structural seniority, and long-term optionality.
- Land ownership acquisition: securing fee-simple title to the underlying land
- Long-term lease to operating property owner: granting leasehold rights over multi-decade terms
- Contractual rent stream: often inflation-linked, creating predictable cash flow
5.2 Typical Structural Parameters
Illustrative SAFR / Group RMC-style parameters include ground lease allocation of 25-35% of property value, rent sizing at 25-40% of stabilized property NOI, and CPI-linked rent escalations every 5-10 years.
6. Return Architecture
Ground lease investment returns derive from three primary components: contractual yield, inflation protection, and valuation repricing. Together, they explain both the stability of income and potential for long-term value appreciation.
6.1 Contractual Yield (Base Income)
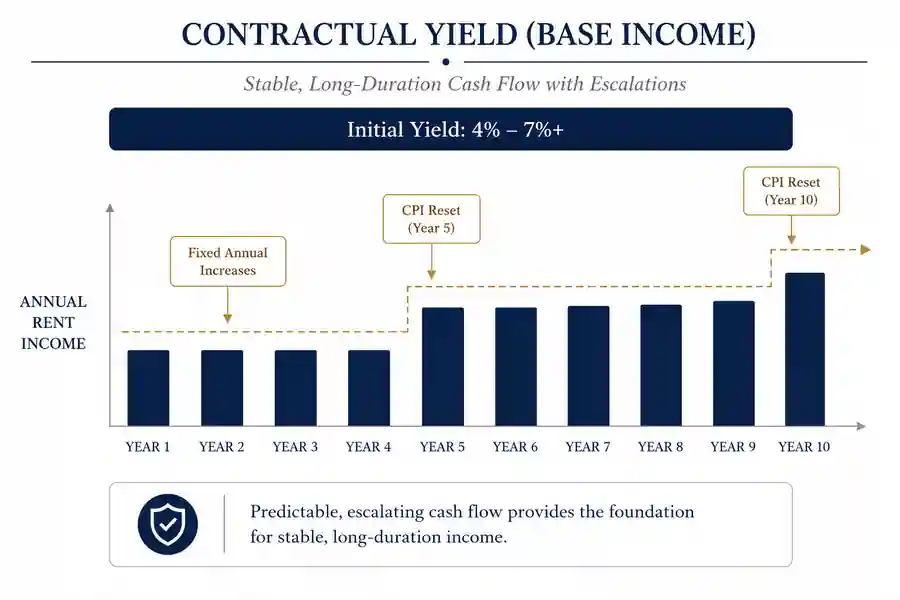
The first component is predictable cash flow from lease payments made by the property owner. Typical initial yields range from 4% to 7%+, depending on structure and property type. Payments often include fixed annual increases and periodic CPI-linked adjustments.
6.2 Inflation Protection
Lease agreements typically include rent escalators tied to inflation measures. CPI resets every 5-10 years provide a mechanism to protect real income against rising costs and align cash flows with broader economic conditions.
6.3 Valuation Repricing (Key Driver)
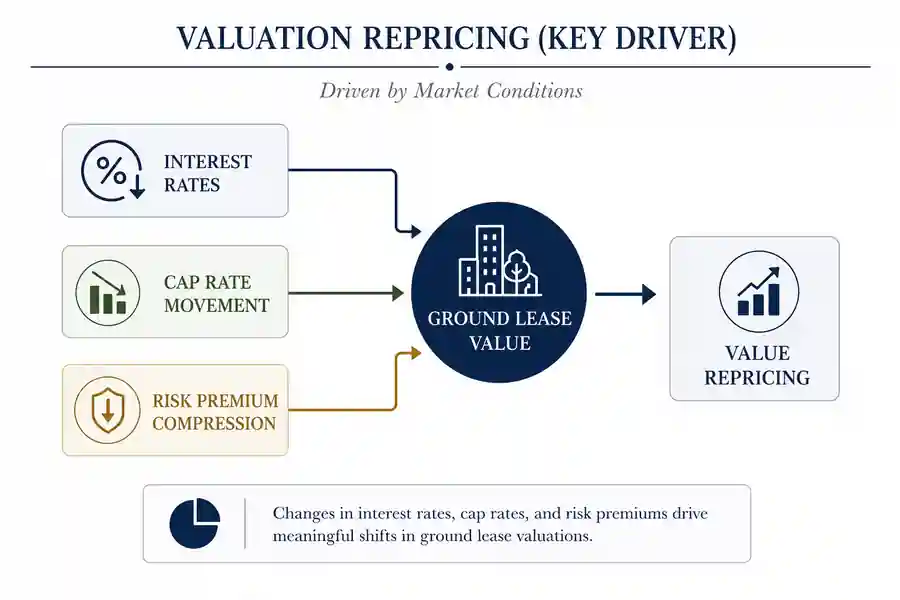
Ground lease valuations are sensitive to interest rate changes, cap rate movement, and risk premium compression. Even when contractual income remains fixed, market-driven repricing can materially affect the present value of long-duration ground leases.
7. Cap Rate Dynamics (Core Economic Engine)
7.1 Correct Interpretation
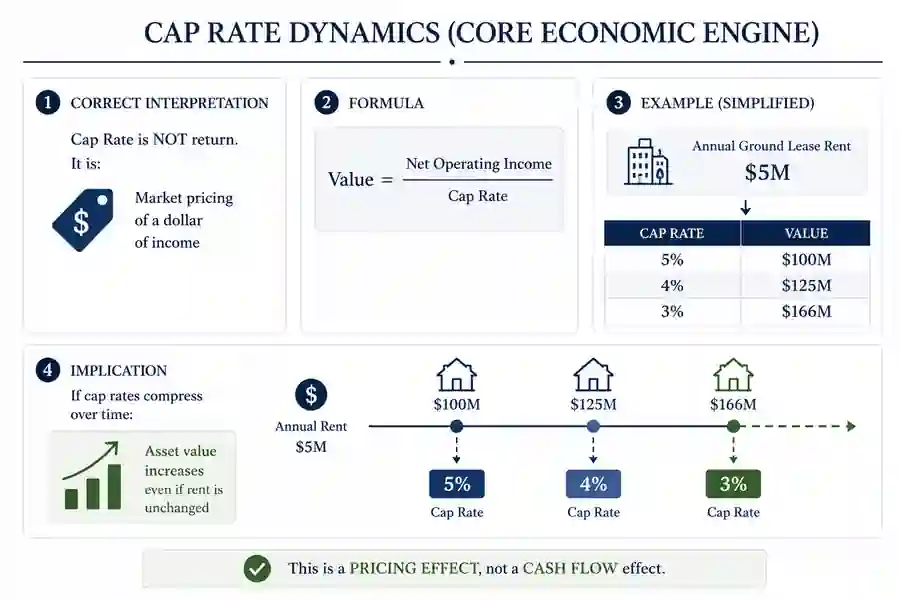
Cap rate is often misunderstood as a measure of return. In reality, it represents the market pricing of a dollar of income, not the cash flow itself. Ground leases are particularly sensitive to this metric because they provide long-duration contractual income streams evaluated in present-value terms.
7.2 Core Formula
The fundamental valuation relationship is value equals net operating income divided by cap rate.
| Cap Rate | Value on $5M Annual Ground Lease Rent |
|---|---|
| 5% | $100M |
| 4% | $125M |
| 3% | $166M |
This example highlights that value is inversely proportional to cap rate. Even if rent remains unchanged, lower cap rates result in higher asset valuations.
7.4 Implications
- Cap rate compression drives asset value independently of contractual cash flows
- This is a pricing effect, not a cash flow effect
- For long-duration ground leases, cap rate dynamics are essential to valuation changes driven by market conditions rather than operating performance
8. Why the Current Environment Is Structurally Attractive
8.1 High-Rate Entry Point Advantage
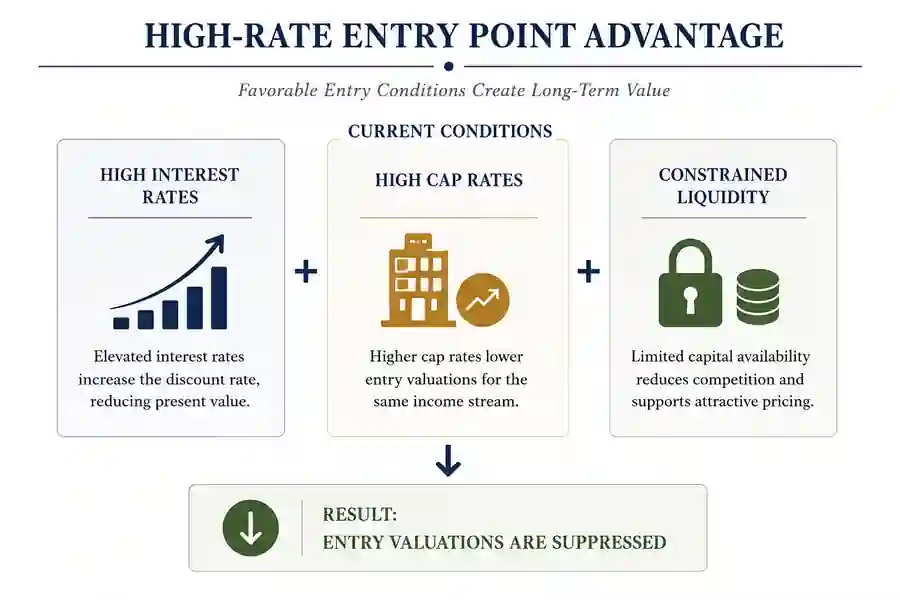
Elevated interest rates, high property cap rates, and constrained liquidity have led to suppressed entry valuations. These conditions can allow investors to acquire high-quality ground lease positions at favorable initial yields relative to historical norms.
- High interest rates
- Elevated cap rates on comparable properties
- Limited availability of liquidity for traditional debt and mezzanine financing
8.2 Forward Asymmetry
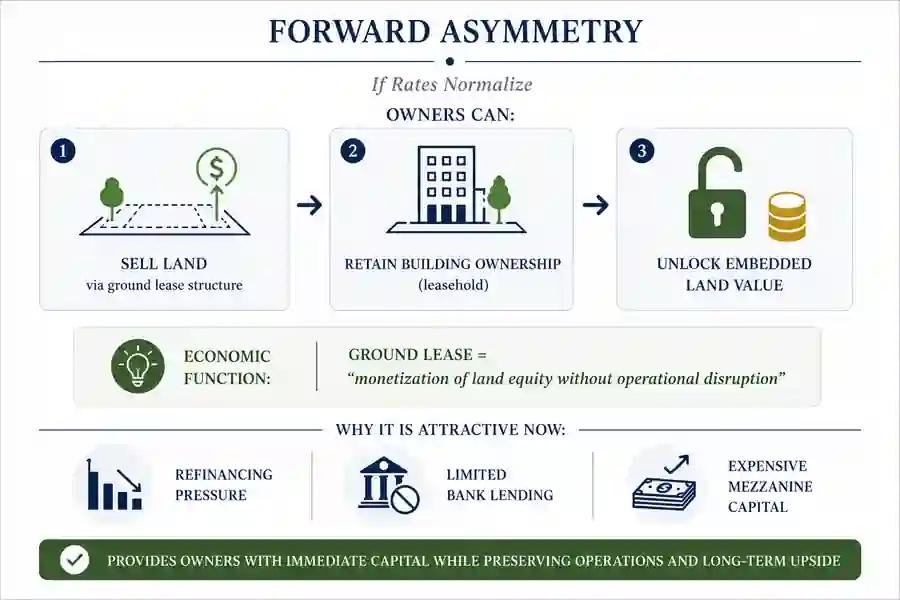
Should interest rates normalize over time, refinancing conditions can improve, cap rates can compress, and institutional demand for ground lease exposure can rise. This creates upside potential beyond contractual income without increasing exposure to short-term operational risk.
8.3 Key Asymmetry
The resulting risk-return profile is asymmetric: downside is protected by stable contractual income from lease payments, while upside can be captured through valuation re-rating as rates fall and market conditions improve.
9. Capital Release Mechanism for Property Owners
9.1 Overview
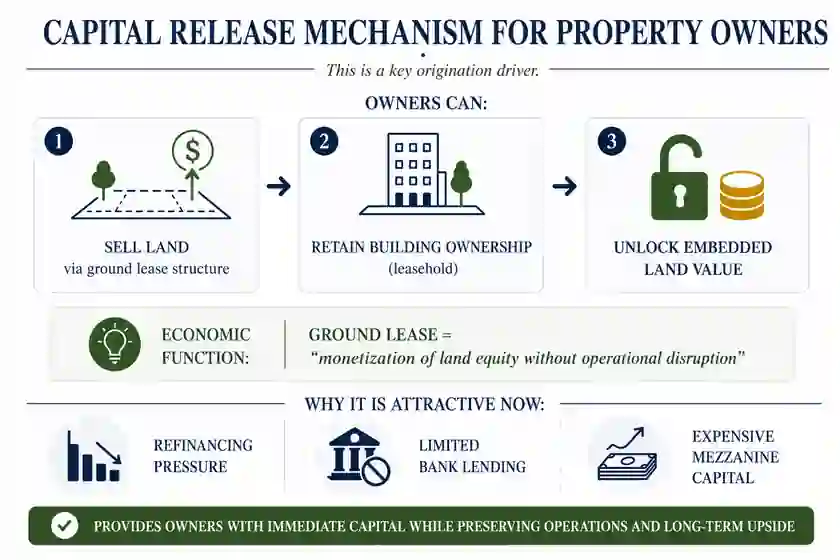
A key driver of ground lease origination is the capital release opportunity for property owners. By monetizing the land beneath a building while retaining operational control, owners can access liquidity without disrupting ongoing operations.
9.2 How It Works
- Sell the land via a long-duration ground lease
- Retain ownership and operational control of the building through the leasehold
- Unlock embedded land value to finance obligations or fund growth
From an economic perspective, ground leases serve as monetization of land equity without operational disruption.
9.3 Why It Is Attractive Now
Refinancing pressure, limited bank lending, and expensive mezzanine capital create a window in which ground lease transactions can provide immediate capital and favorable terms for long-duration ownership.
10. Investment Role vs. Debt Strategies
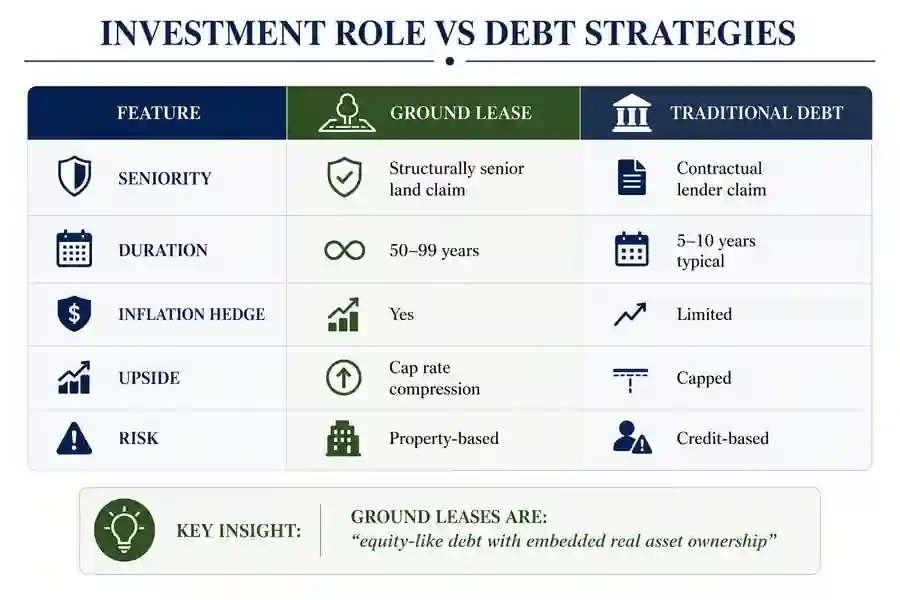
Ground leases occupy a unique position in institutional portfolios, combining aspects of credit and equity while providing exposure to real assets. Unlike traditional debt instruments, ground leases offer long-duration, structurally senior claims backed by land ownership and contractual rent streams.
10.1 Feature Comparison
| Feature | Ground Lease | Traditional Debt |
|---|---|---|
| Seniority | Structurally senior land claim | Contractual lender claim |
| Duration | 50-99 years | 5-10 years typical |
| Inflation Hedge | Yes | Limited |
| Upside | Cap rate compression | Capped |
| Risk | Property-based | Credit-based |
10.2 Key Insight
Ground leases are equity-like debt with embedded real asset ownership. This framing helps institutional investors understand the combination of structural seniority, long-duration contractual cash flows, and upside optionality from valuation appreciation.
11. Liquidity Architecture
11.1 Overview
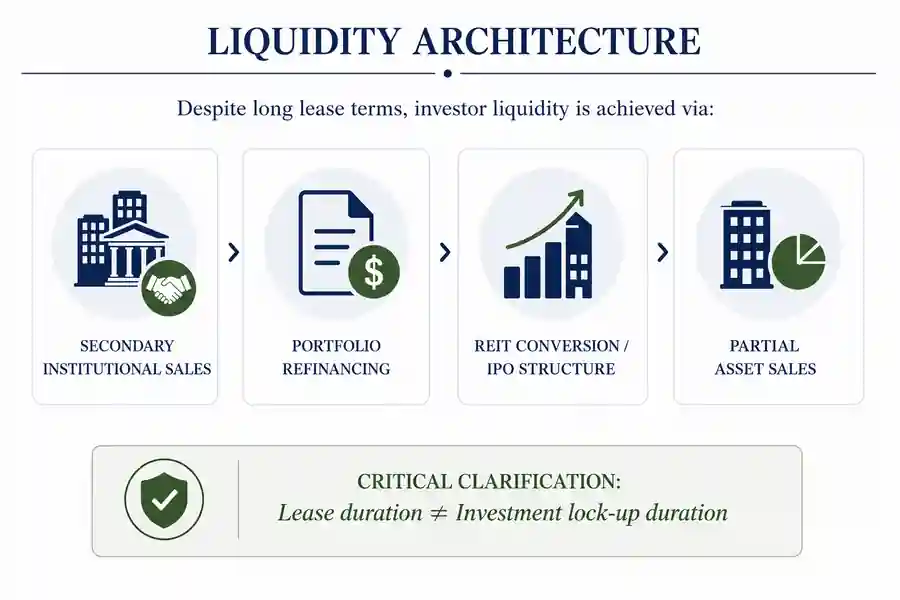
Ground leases are long-duration instruments, often extending 50-99 years, which could suggest illiquidity. However, investors can access liquidity well before lease expiration through structured mechanisms built into institutional offerings.
11.2 Mechanisms for Investor Liquidity
- Secondary institutional sales to investors or funds seeking long-duration, structurally senior land-backed positions
- Portfolio refinancing of diversified ground lease holdings
- REIT conversion or IPO structures that create public or private trading vehicles
- Partial asset sales to balance liquidity and long-term exposure
11.3 Critical Clarification
Lease duration does not equate to investor lock-up. While contractual lease terms may be very long, liquidity options can allow investors to exit positions or realize value without waiting for the full lease term.
12. Risk Framework
12.1 Key Risks
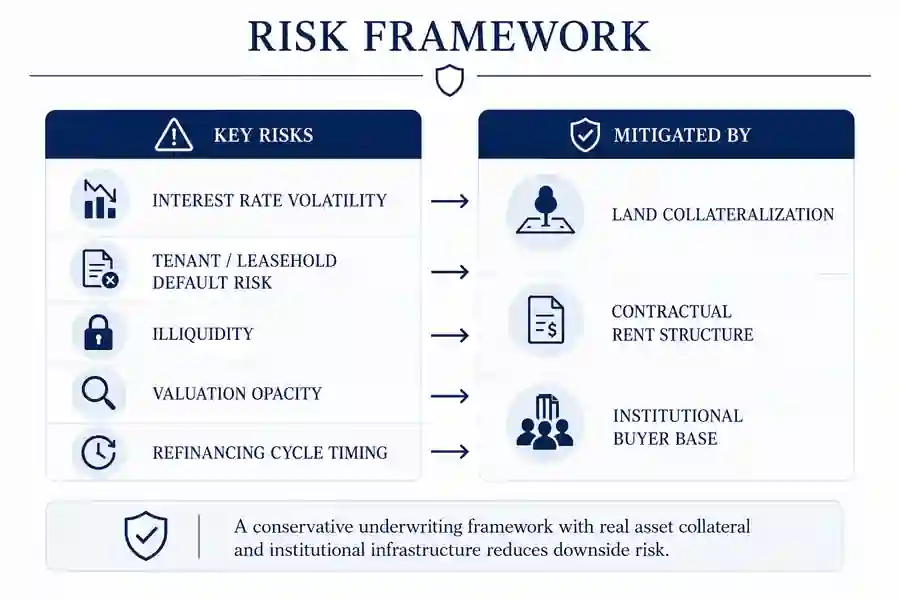
Ground lease investments, like any long-duration real estate exposure, are subject to structural and market risks.
- Interest rate volatility can affect market valuation of long-duration leases
- Tenant or leasehold default risk can disrupt cash flows
- Illiquidity can remain relevant despite exit mechanisms
- Valuation opacity can make pricing less transparent than traded instruments
- Refinancing cycle timing can influence returns
12.2 Mitigation Mechanisms
- Land collateralization provides a durable recovery mechanism
- Contractual rent structure supports stable long-term cash flows
- Institutional buyer base supports liquidity and pricing integrity
13. Strategic Conclusion
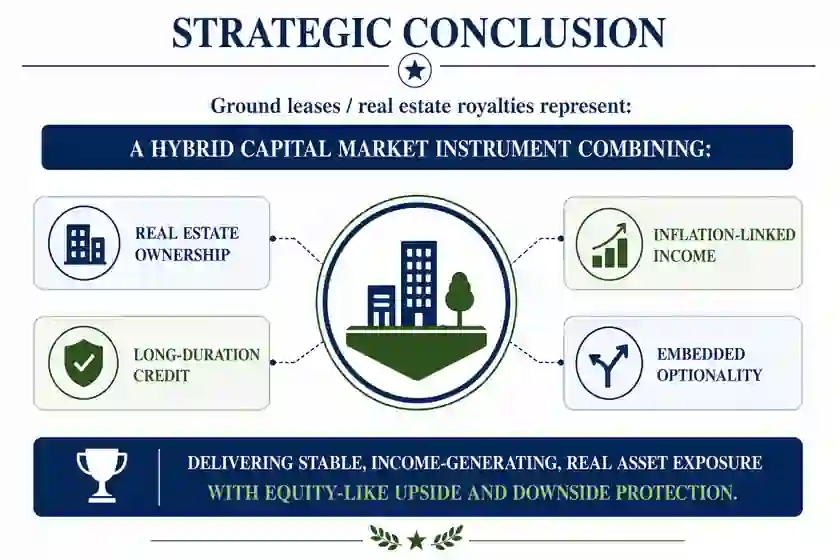
Ground leases, also referred to as real estate royalties, represent a hybrid capital market instrument that merges characteristics of real estate ownership, long-duration credit, inflation-linked income, and embedded optionality. This combination positions them uniquely within institutional portfolios, providing stable income while offering potential upside through market-driven repricing and long-term land value appreciation.
13.1 Core Characteristics
Fee-simple land ownership underpins the investment, granting structural seniority and legal control independent of operational cash flows. Contractual rent streams over decades provide predictable income comparable to long-term fixed-income instruments, while remaining insulated from short-term operational risk.
Periodic rent escalations tied to CPI protect the real purchasing power of cash flows. The investment also retains exposure to long-term land appreciation, cap rate compression, and valuation re-rating.
13.2 Institutional Implications
For institutional investors, the hybrid profile offers downside protection through contractual cash flows and land-backed security, upside optionality through market repricing and long-term appreciation, and portfolio diversification through an asset class that is lowly correlated with traditional bonds and equities.
The combination of these features makes ground leases a potentially attractive component for long-term, risk-conscious institutional portfolios seeking both yield and asset-backed security.