
A client sees a private company becoming a household name and asks a reasonable question: can we own it before it goes public? A venture or growth fund may make the answer yes. The harder question is what the client will earn from the price available today.
The company may already have delivered its most extraordinary gains to earlier investors. Its next financing may carry a much higher valuation. The fund may own only a small position, hold it through an uncertain exit, and deduct several layers of cost before the result reaches the client. The company can succeed while the investor’s return disappoints.
Our central question is whether a wealth portfolio receives enough of venture’s potential upside to justify the risks it retains. Easier access can be valuable. It does not establish an attractive investment price, a return premium or a dependable source of cash.
Our research across StepStone SPRING, Adams Street Venture & Growth, ABS Pre-IPO and Growth, Hamilton Lane Venture Capital and Growth, Partners Group Growth, and ARK Venture, with Fundrise Innovation as a listed comparison, brings that question into focus. The investment label covers markedly different portfolios. Some rely heavily on secondary transactions; others concentrate on late-stage companies or combine public and private innovation exposure.
The research has not established a consistent, comparable net return advantage over the secondaries strategies we have studied. That is a reason to demand a clearer economic case, not a finding that every venture fund underperforms. Our simulations contain different calibrations and unresolved inputs, and several vehicles have short histories.
View full-size figure
Why private growth access has become an allocation question
Venture capital exists because some promising businesses need equity capital before they can support conventional lending or generate reliable cash flow. Investors accept business and financing uncertainty in exchange for a share of possible future value. Growth equity generally enters after more of the business has been established, financing expansion while still accepting substantial execution and valuation risk. These are investments in the real economy, just as buyouts are; the maturity, financing and ownership arrangements differ. [20]
Wealth access vehicles address a different need. An advisor can delegate company selection, obtain a portfolio through one subscription, and fit reporting and administration into an existing practice. Periodic repurchases may provide some flexibility. These features make the investment easier to own, but they do not change how long a company takes to mature.
Institutions did not arrive in venture only after these products appeared. Pensions, endowments and foundations have long financed venture partnerships. The newer challenge is fitting that exposure into a broader set of investor accounts, liquidity needs and distribution channels. A conservative overall portfolio can include an explicitly risky sleeve; the sleeve does not become conservative because of where it is sold. [20]
The opportunity set also changed. The 2026 NVCA Yearbook reports that the median time from first venture funding to IPO reached 7.85 years among 2025 IPO exits. This is an observation about companies that reached an IPO, not an expected waiting time for every private holding. It helps explain why allocators seek access before listing. [19]
At the same time, visibility has become concentrated. NVCA reports that AI and machine learning represented 65.4% of US venture deal value in 2025. A portfolio of many private companies can therefore share important economic drivers with the public technology stocks the client already owns. The inference for advisors is that private ownership can broaden company access without creating equivalent diversification from the growth cycle. [19]
The investor entering and the investor leaving
In a venture secondary transaction, the new investor’s access is an existing owner’s liquidity. Employees, early investors or fund investors may want to sell before the company exits. A wealth vehicle can purchase that exposure and take over the remaining holding period. This can be a useful exchange: the seller need not believe the company is failing, and the buyer need not receive a bargain simply because the shares are private.
That exchange is the starting point for our analysis. What matters is the remaining opportunity at the new entry price, including the capital and time still required to realize it. The history that made a company famous belongs partly to somebody else.
Why a winning company may deliver an ordinary return
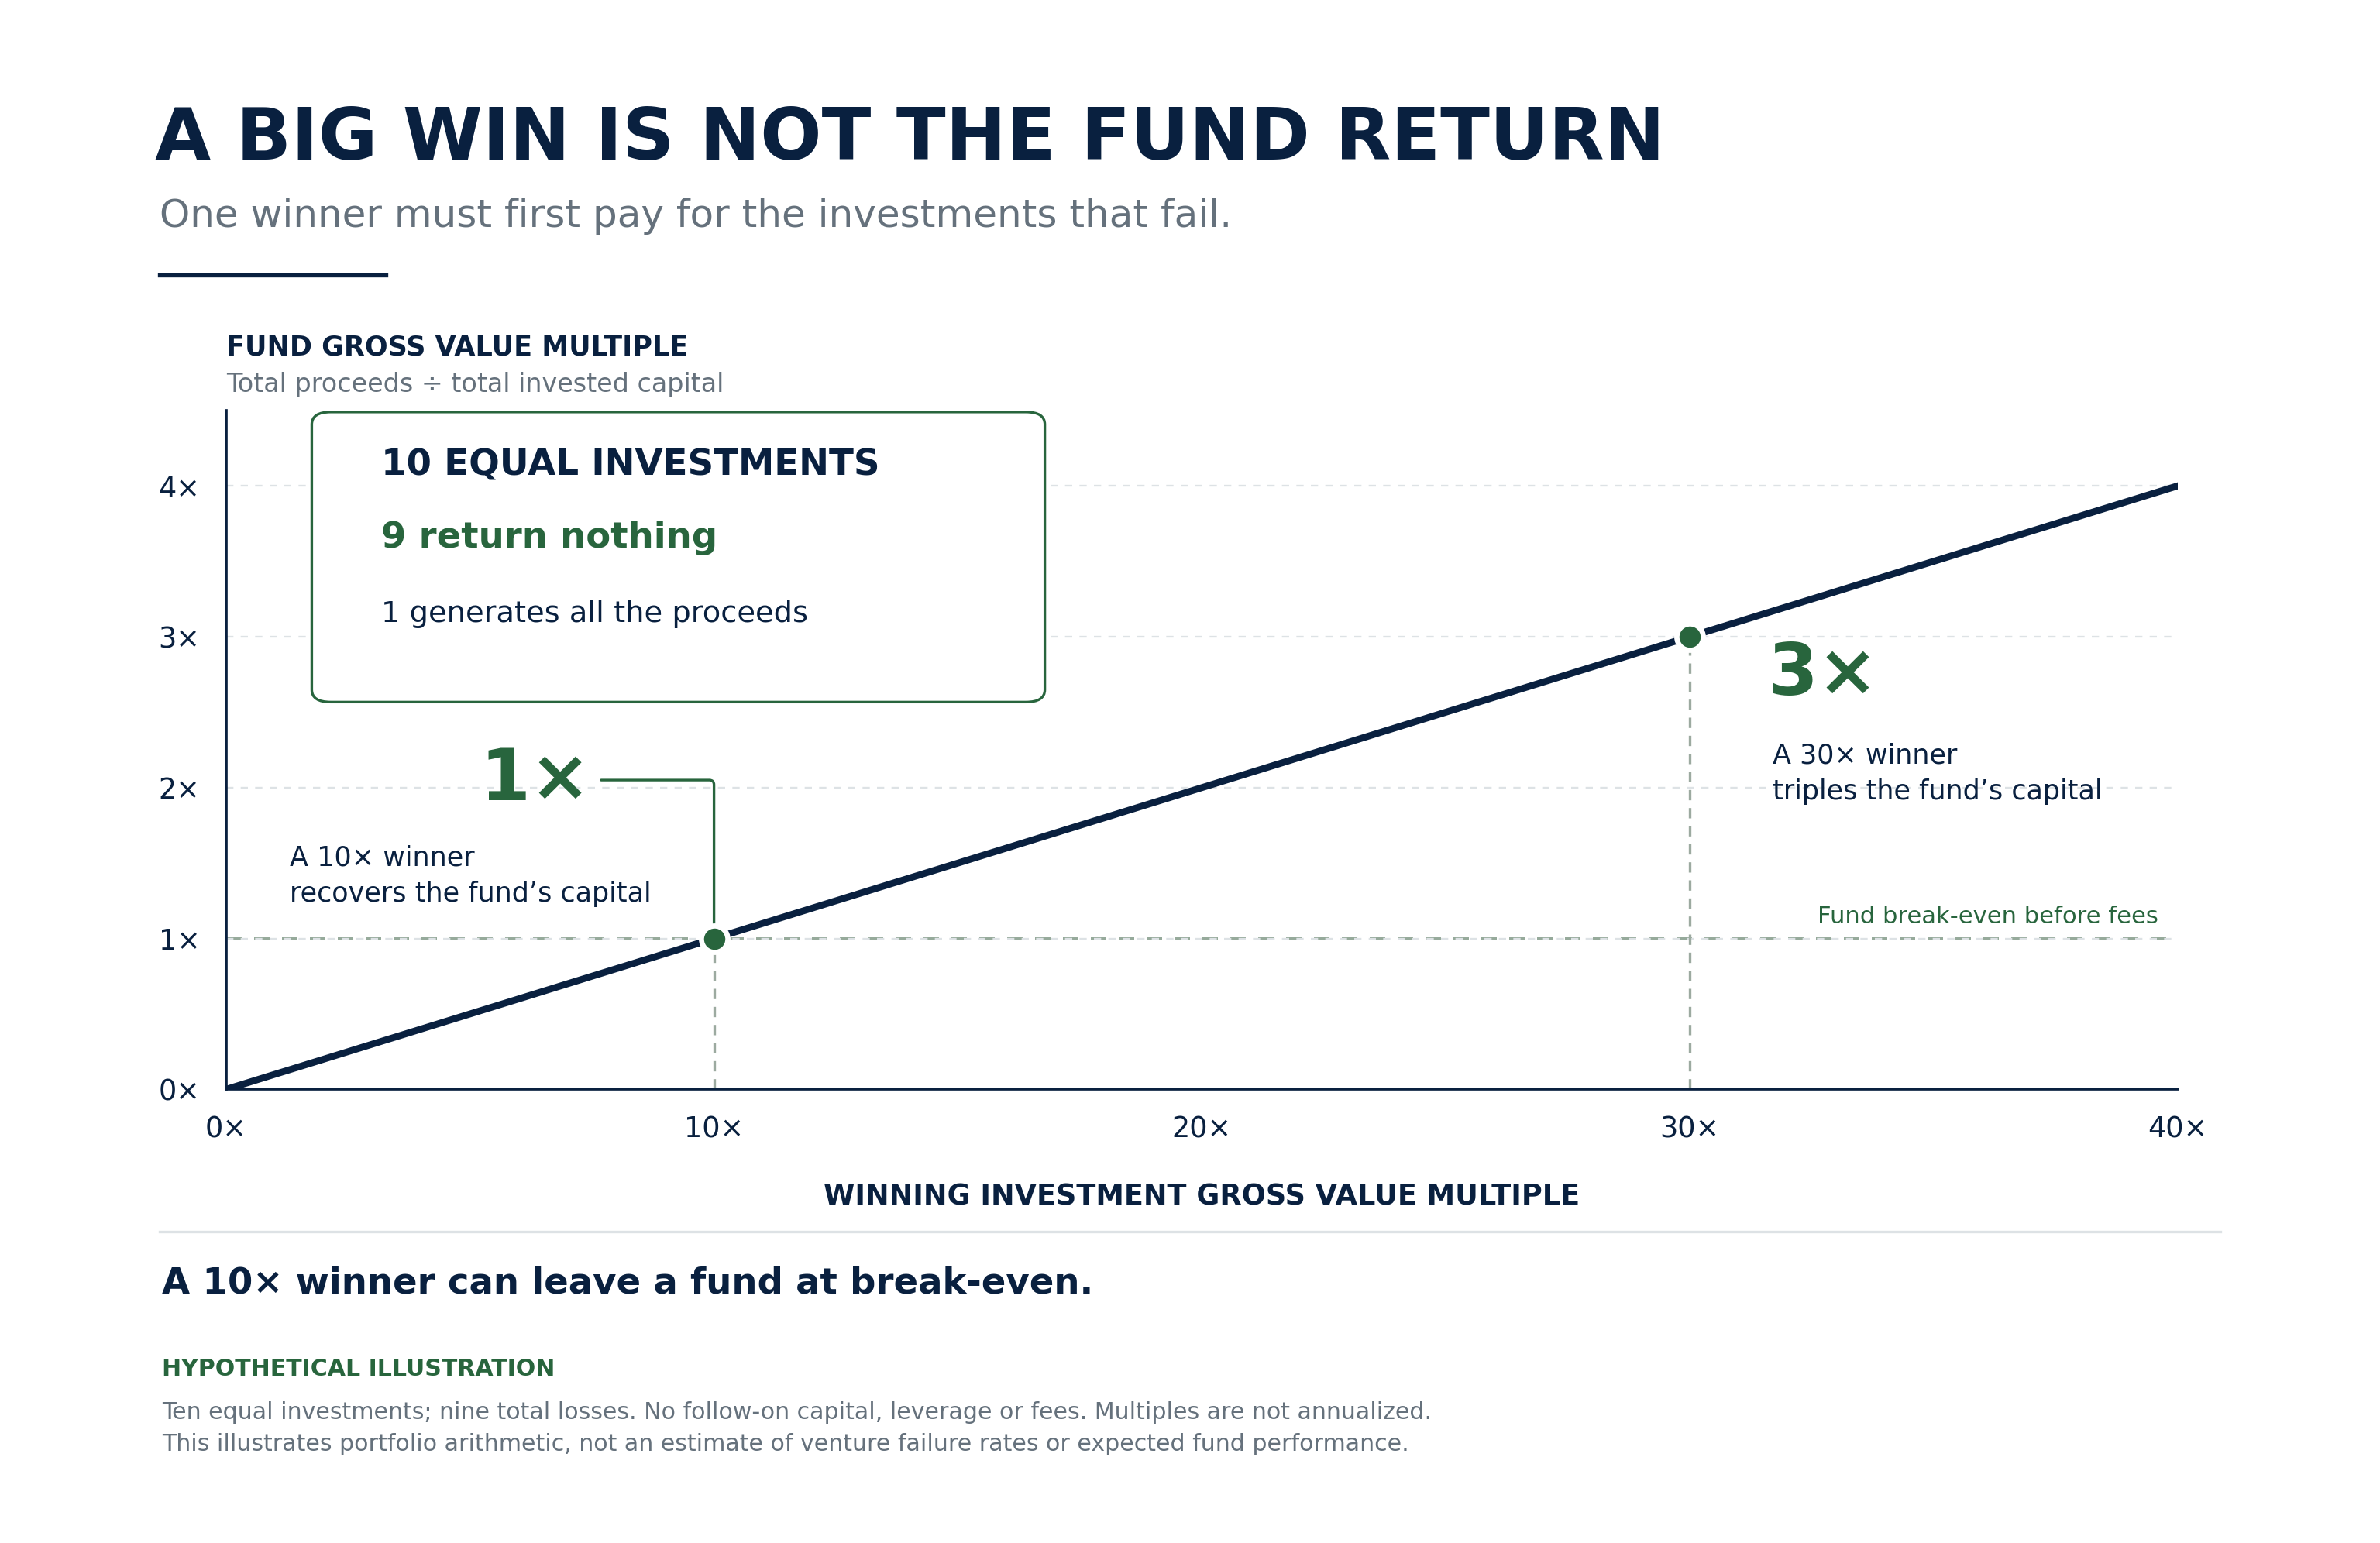
Venture outcomes are uneven. A small number of investments can contribute a large share of a portfolio’s gains. The familiar example of one winner paying for many failures illustrates the arithmetic; it is not a universal failure rate. A manager also has to obtain meaningful ownership, decide where to invest additional capital, and preserve the ability to hold a winner.
Consider ten equal investments of $1. If nine become worthless and one returns $10, the portfolio merely recovers its original $10 before fees. If the winner returns $30, the portfolio returns three times invested capital before fees. The spectacular company outcome and the portfolio outcome are different numbers. These are hypothetical examples, not estimates of venture success rates.
View full-size figure
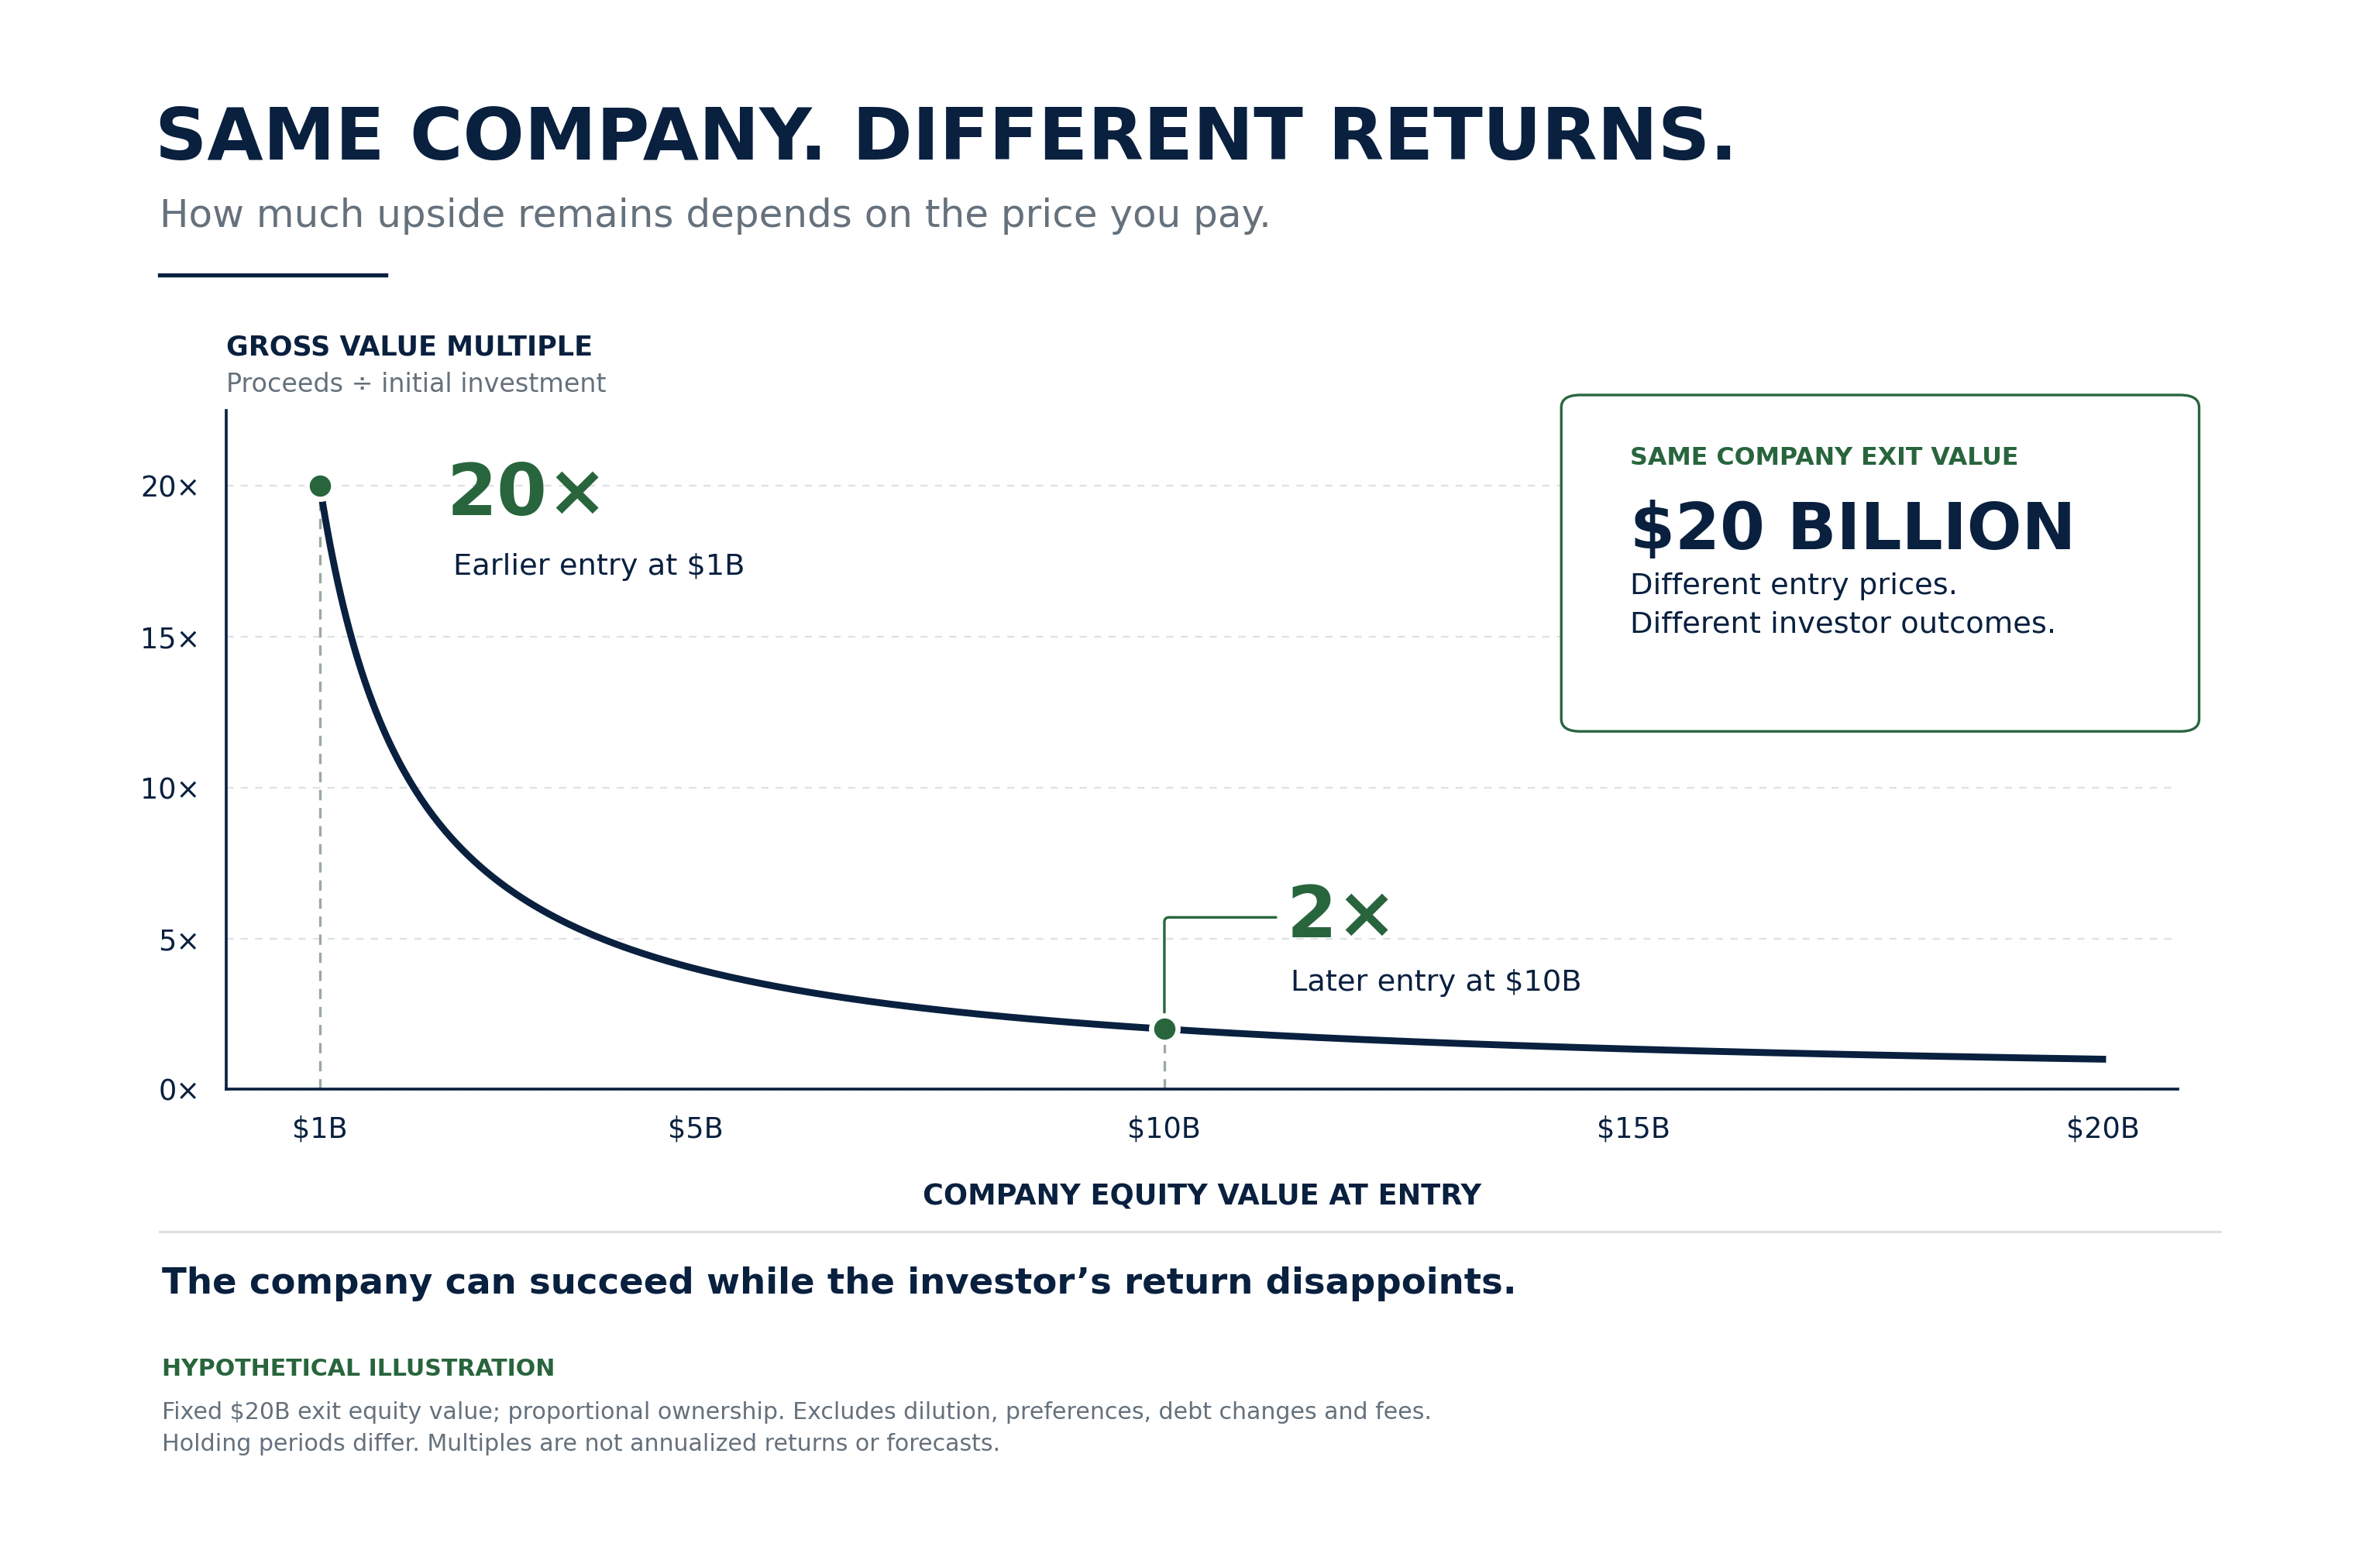
The entry price determines which part of the success is yours
| Illustrative investor | Company equity value at entry | Same eventual equity value | Gross value multiple |
|---|---|---|---|
| Earlier investor | $1 billion | $20 billion | 20 times |
| Later investor | $10 billion | $20 billion | 2 times |
Simplified illustration with proportional ownership and no dilution, preferences, debt changes or fees. The holding periods differ, so these multiples are not an annualized return comparison. Actual security terms can materially change the proceeds.
The later investment can still be excellent. It may involve a better established company and a shorter wait. But buying a recognizable name at a later valuation does not reproduce the economics of the original venture investment. An advisor needs a thesis for the next increment of value, not just evidence that the company has already created a great deal of it.
Selection matters at both company and manager level
Harris, Jenkinson, Kaplan and Stucke find persistence in venture fund performance even when using information available to investors at the time of fundraising. Their study also distinguishes different fund styles within a manager. This supports taking manager selection seriously; it does not make a famous firm’s next fund a guaranteed winner or transfer a flagship track record to a new wealth vehicle. [22]
Concentrated gains should not be confused with an industry-wide rate of capital loss. Making a nominal profit, beating public equities and earning an adequate premium for illiquidity are different tests. In its 2012 study, Kauffman found that 62 of its 100 funds failed to beat public markets after fees and carry; 20 exceeded a public-market equivalent by more than three percentage points annually. That historical portfolio study documents how difficult it can be to earn sufficient compensation for venture exposure. [21]
What diversification changes and what it does not
Diversification is not a contradiction of venture investing. Before the winners are known, exposure to more credible opportunities can reduce the chance of missing them. Even a highly selective venture firm owns a portfolio and commonly reserves capital for follow-on investments. Concentration after a company succeeds is different from concentrating all the capital in a company selected from today’s headlines.
If additional investments have the same expected return and the portfolio is reweighted without changing costs, adding them does not mechanically lower the expected arithmetic return. It changes the distribution of outcomes. In practice, diversification can reduce the expected return when expansion requires buying weaker opportunities, paying more, or diluting a scarce selection advantage. That is a question about the quality and price of the added exposure, not the number of holdings alone.
The concern raised by our research is therefore more specific. A vehicle can reduce single-company concentration while retaining common exposure to expensive growth valuations, future financing and the IPO market. Meanwhile, later entry prices, cash requirements and fund expenses can reduce the return that reaches the investor. The investment may become less spectacular without becoming proportionately less vulnerable.
How the potential premium can shrink
Later entry. More business progress is visible, but its value may already be in the price. A secondary purchase can improve that price; a subscription into an existing fund at NAV generally includes appreciation already recognized in that NAV.
Limited effective ownership. A large gain in one company has a small effect if the fund’s exposure is small. Several funds or SPVs can also hold the same company, so the number of line items can overstate diversification.
Costs and cash. Underlying fund carry, SPV charges, operating expenses, management and incentive fees, and liquidity holdings can all affect the result. They must be measured on the correct bases. A return already net of an expense should not be charged that expense again.
The time to receive proceeds. A financing mark is not a sale, an IPO is not necessarily immediate cash, and fund cash may be reinvested instead of paid to shareholders. Restrictions, additional funding and delays affect the value of the investment to its owner.
These mechanisms have visible counterparts in the researched funds: ABS has substantial disclosed company concentration; ARK combines public and private innovation assets and meaningful ongoing expenses; several platform funds invest through underlying structures and apply incentive mechanics. Their specific differences matter more than a generic venture label. [1, 3, 5–13]
Broader access can also change prices. An August 2026 working paper by Pastor, Stambaugh and Taylor models how opening private markets to retail investors lowers private firms’ cost of capital and reduces private equity’s alpha. This is a theoretical result, not evidence that our funds have experienced that effect. It nevertheless highlights a useful possibility: part of the benefit of new demand can accrue to existing owners and companies rather than to new investors. [23]
Why secondaries provide a demanding comparison
An advisor does not have to choose an allocation simply because a product category has become accessible. Venture and growth should be compared with the alternatives for the same capital, including the client’s public portfolio and other private-market strategies. Our secondaries research gives that comparison practical substance.
A seasoned buyout secondary may combine existing operating businesses, a negotiated entry price and a more developed path to realizations. A venture investment may depend more heavily on a limited number of large outcomes and future financing. Those differences can justify different expectations. They do not establish that all secondaries are safer or more profitable: leverage, sector exposure, entry valuations and company quality still matter.
Venture and secondaries are not mutually exclusive categories
| Question | Venture or growth secondary | Seasoned buyout secondary |
|---|---|---|
| What drives value | Company growth, financing, selection and entry terms | Operating performance, capital structure and entry terms |
| What may delay cash | Further rounds, sale restrictions and uncertain exits | Slower realizations, refinancing and asset sales |
| What requires verification | Remaining upside, ownership rights and capital needs | Asset quality, leverage and remaining realization path |
Venture describes the underlying investment exposure. Secondary describes how an existing interest is purchased. Adams Street Venture & Growth’s April prospectus, for example, targets 60–80% in secondaries, excluding liquid assets. SPRING also uses secondary transactions. Comparing “venture” with “secondaries” without specifying the underlying businesses can therefore compare overlapping sets. [1, 3]
Conceptual comparison, not an empirical ranking. Either category can contain concentrated or stressed assets, and either can be acquired at an unattractive price.
The finding our research can support
Our work has not yet demonstrated that these venture and growth vehicles consistently deliver a net premium over the secondaries alternatives. The comparison remains incomplete because model versions, assumptions, horizons and reference portfolios are not fully aligned. This raises a question about compensation for risk; conditional projections do not establish observed fund performance.
The decision rule is still clear. If the credible expected net return is similar, and venture adds financing dependence, concentration or a longer uncertain exit, the advisor needs another defensible benefit to justify it. Access to a differentiated opportunity may qualify. A recognizable company name by itself does not.
Lower reported volatility is insufficient evidence in the other direction. Periodic private valuations can delay recognition of losses. An economic comparison needs common stress scenarios, company exposures, leverage, cash needs and recovery paths, alongside returns. Lower standard deviation does not itself cause higher expected performance, although reducing variance can improve compound growth when other conditions are comparable.
What an SPV changes in the investment decision
A single-company special purpose vehicle can feel like a direct answer to the problem of diluted upside. The investor chooses the company, avoids unrelated holdings and participates more directly in its outcome. But an SPV changes the location of the selection decision. It does not remove it.
The investor must evaluate the price, the specific security, its place in the capital structure, transfer restrictions, information rights, sponsor incentives and future dilution. Ownership through an SPV may provide fewer rights than the headline financing suggests. The presence of a respected venture investor on the company’s capitalization table does not establish that the SPV owns the same security on the same terms.
A professional venture manager may have backed the company early, supported it operationally, reserved capital for later rounds and held it within a broader portfolio. The wealth client entering one SPV at a later valuation is making a different investment. Media recognition cannot substitute for those decisions.
| Choice | What the investor gains | What remains to be solved |
|---|---|---|
| Single-company SPV | Targeted exposure and a more concentrated share of upside | Independent underwriting, total-loss capacity, terms and follow-on funding |
| Diversified venture vehicle | Delegated selection and exposure to multiple possible winners | Manager advantage, effective overlap, total costs and liquidity design |
| Venture secondary vehicle | Exposure to existing assets at negotiated terms | Fair value, seller motivation, rights and remaining capital requirements |
These are overlapping structures: a diversified fund may own SPVs and purchase them in secondary transactions. Actual rights, costs and access depend on the documents, not this conceptual summary.
A defensible reason to concentrate
An SPV can make sense for an investor with a specific, researched investment thesis, the capacity to lose the allocation, and enough liquidity elsewhere to wait. The thesis should explain why the offered price and terms are attractive from this point forward. It should not depend solely on believing that a well-known company will remain important.
Diversified funds can make sense for a different reason: the investor is buying a manager’s repeated ability to select and acquire good opportunities. The relevant question is whether that ability survives the vehicle’s scale, mandate and expenses. Neither structure deserves a presumption of superior returns.
For both choices, write down what would make the thesis wrong. A financing at a lower valuation, loss of a major customer, inability to fund growth or a materially delayed exit can matter more than a quarter of unchanged reported NAV. This makes the allocation an underwritten exposure rather than participation in a story.
A downturn tests the ability to buy and the ability to wait
Buying at a better price can matter in venture as much as in other private-market strategies. Existing holders may need liquidity even when the underlying business remains attractive. Secondary purchases, employee share sales or negotiated financings can provide entry opportunities. But a company attracting intense demand may remain expensive even while less favored businesses struggle.
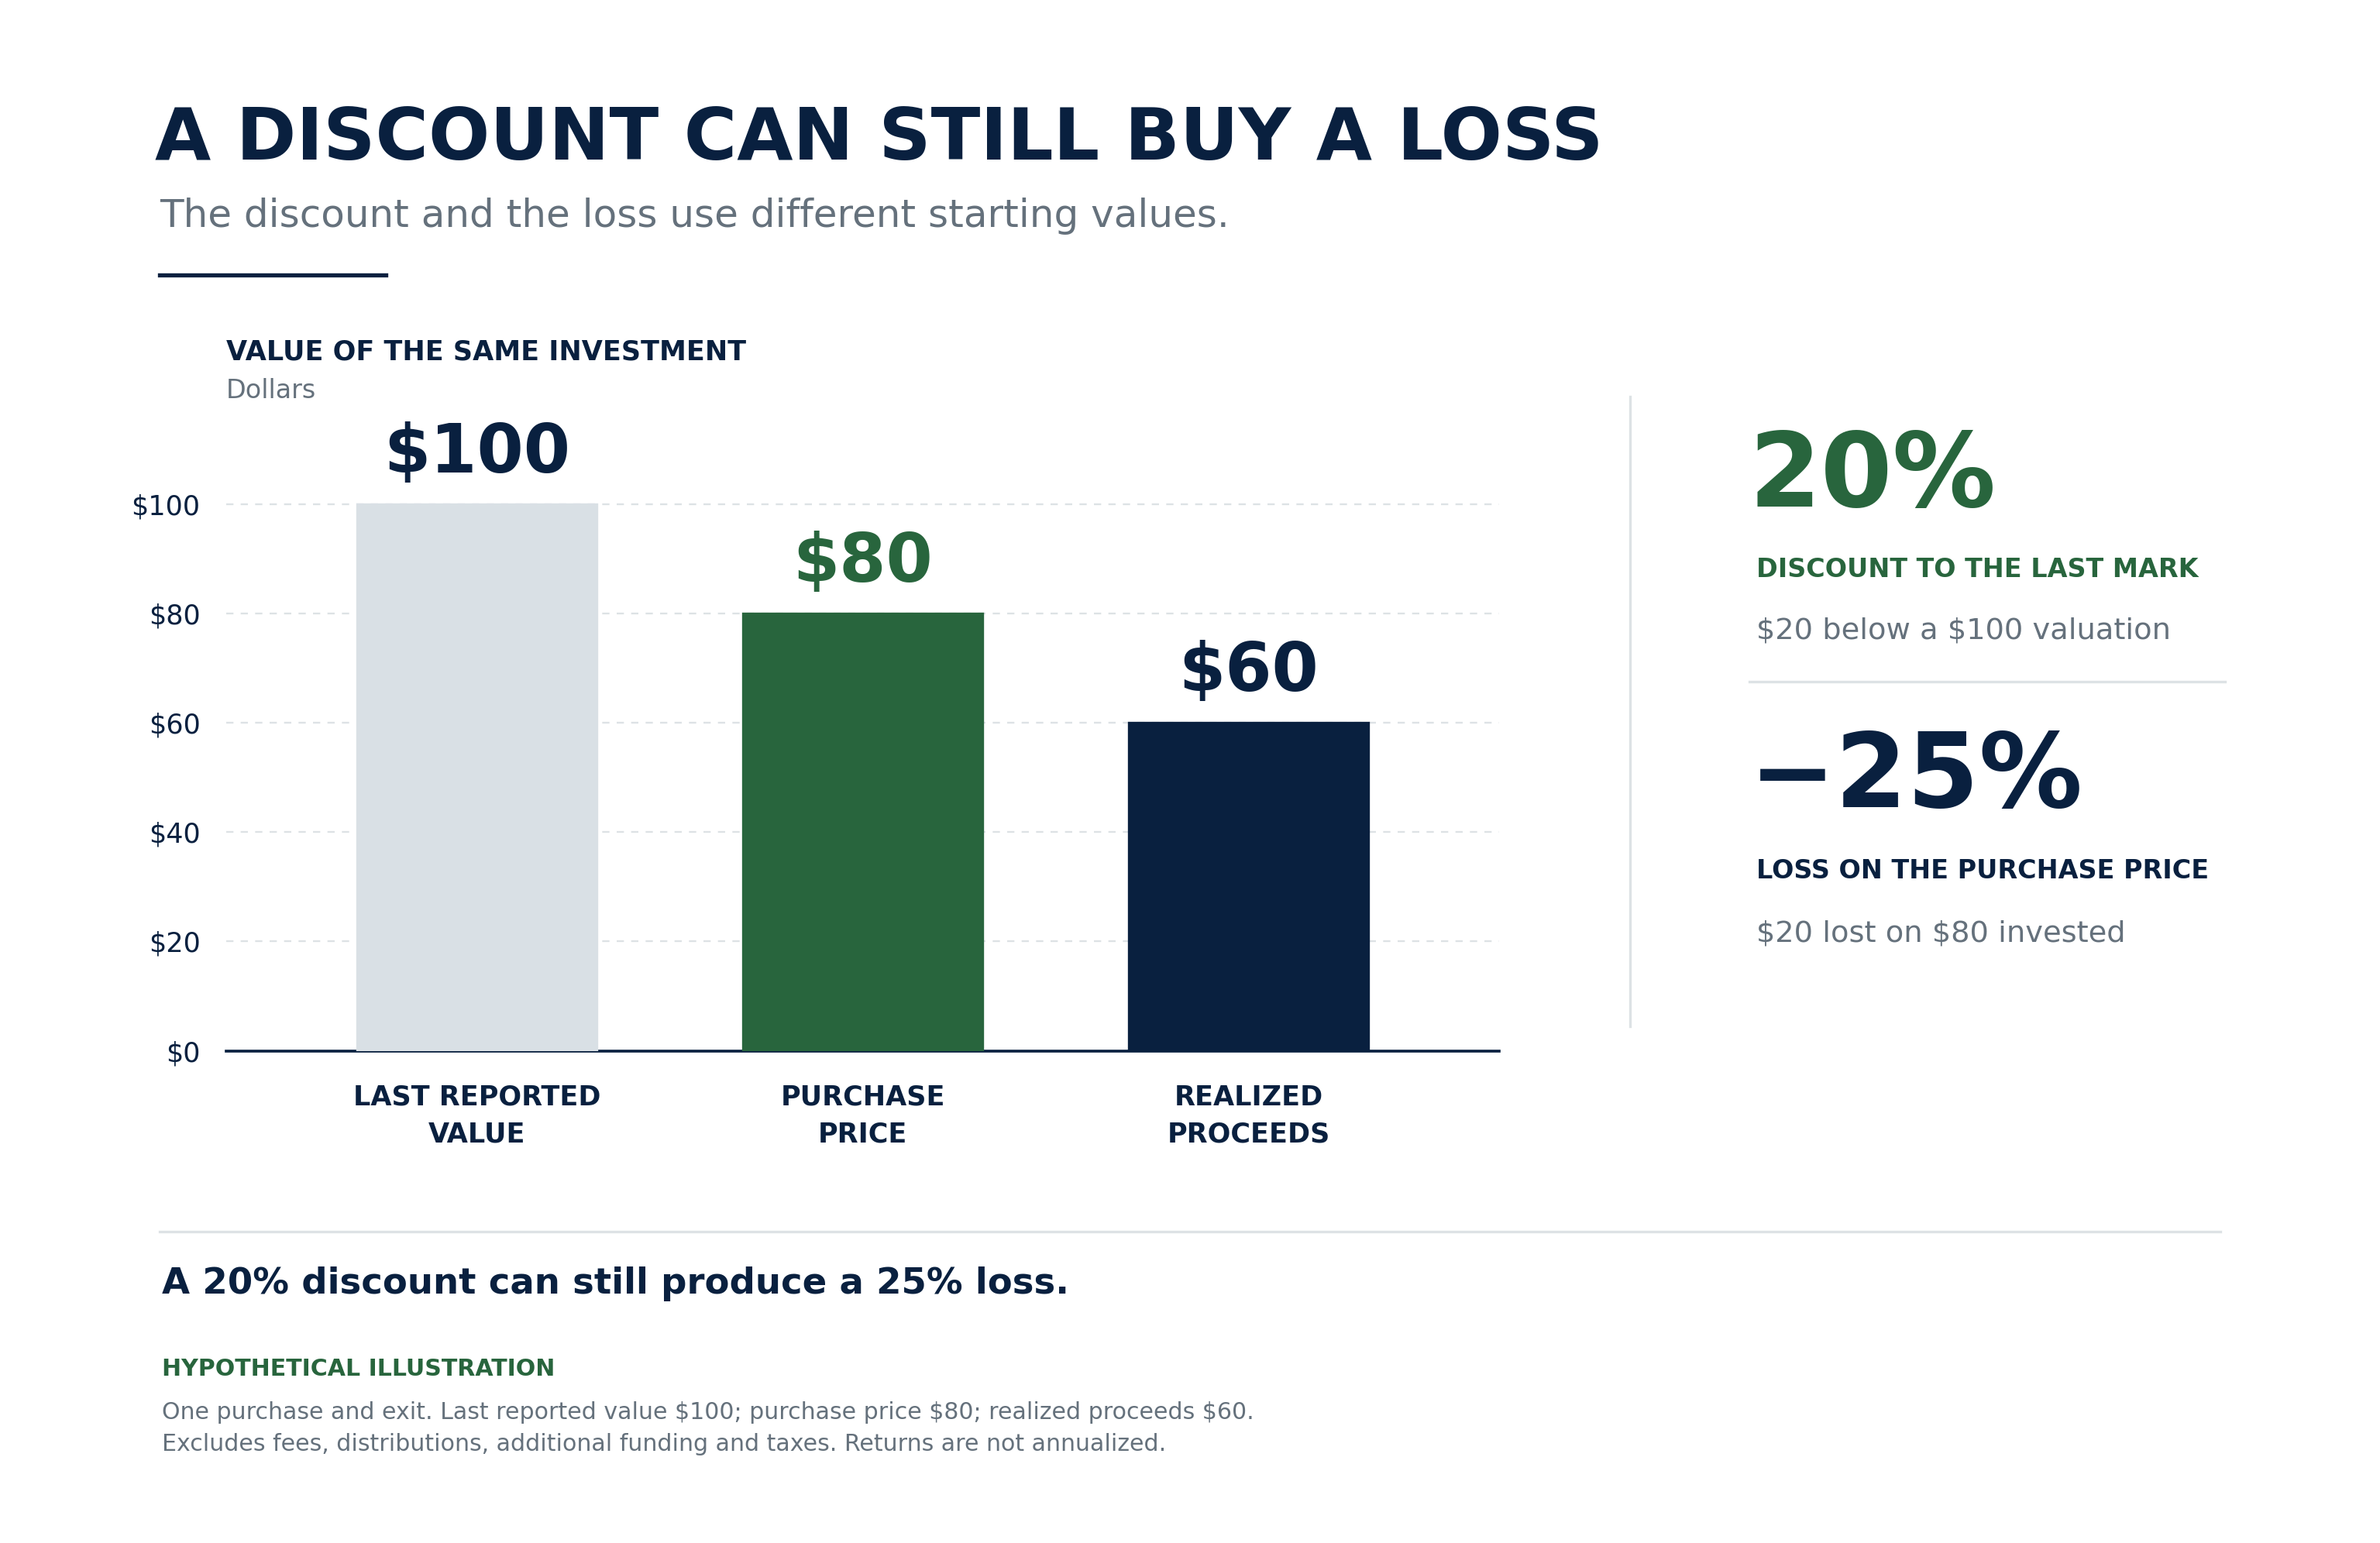
A discount to the last financing or reported NAV is a reference point, not proof of undervaluation. If a position marked at $100 is bought for $80 but its realizable value is $60, the nominal 20% discount has not prevented a loss. Security preferences, additional capital needs and stale marks can make the reference price especially misleading.
View full-size figure
The distinction that matters is between a seller needing cash and a company needing rescue. Both may sell at lower prices. Their prospective economics can be very different.
| Stress event | Pressure on existing assets | Potential advantage for a prepared buyer |
|---|---|---|
| Valuations fall | Lower marks and weaker financing terms | Better entry prices if business value remains intact |
| Exit markets slow | Longer holding periods and less realization cash | Patient ownership where the remaining return is attractive |
| Companies need funding | Dilution, senior securities or failure risk | Selective follow-on investment on defensible terms |
| Fund repurchases rise | Cash competes with commitments and new purchases | Advantage only if capital is actually available |
These are mechanisms to test, not forecasts of the researched managers’ behavior. Buyout portfolios also face recession, refinancing and valuation risks; company stage alone does not determine the outcome.
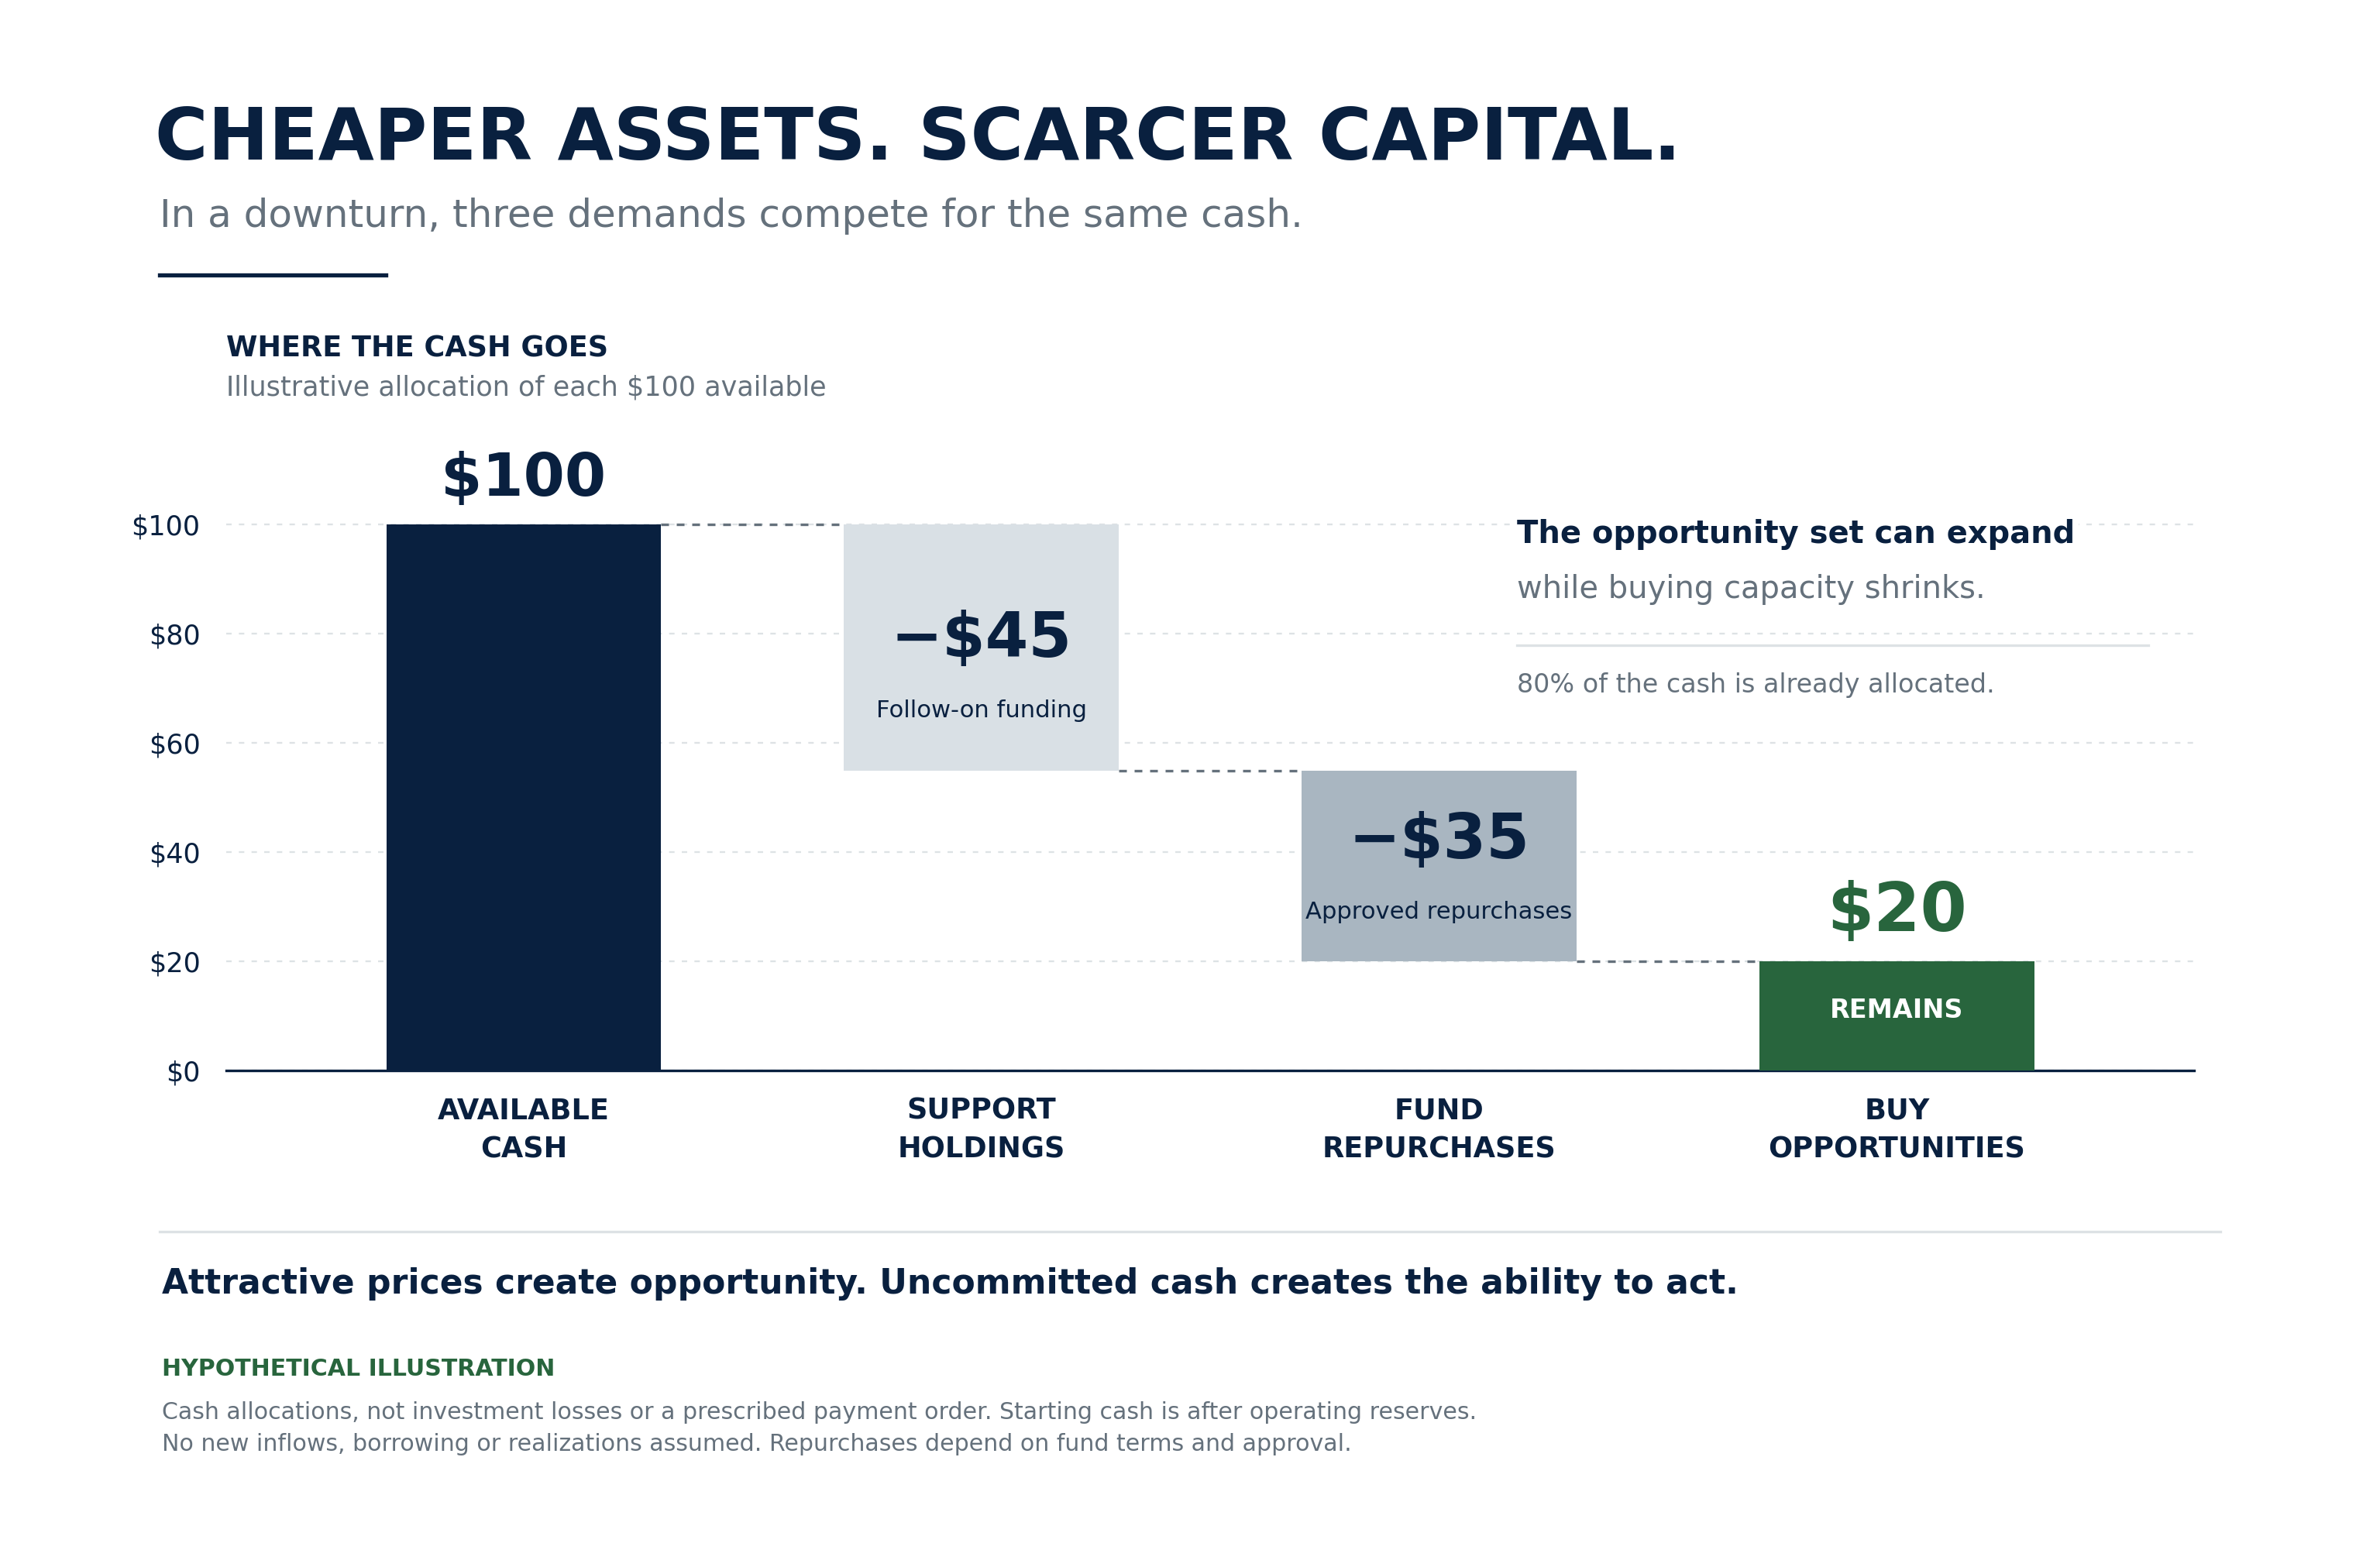
Evergreen capital can help a manager hold an asset beyond a fixed fund term. Periodic shareholder repurchases create a competing demand for cash. Reserves, realizations, borrowing and subscriptions may help, but new inflows cannot be assumed precisely when sentiment weakens. The underlying portfolio and shareholder liquidity arrangement must be evaluated together.
This is where the ability to buy cheaply becomes a portfolio question. An existing fund may take losses on its opening assets while finding better opportunities for new purchases. Attractive new investments do not erase the old losses. A manager must have both buying capacity and enough capital to support current holdings.
The useful test is whether the fund can finance its investment thesis through the difficult period. An attractive long-term projection offers little comfort if the client needs cash before the fund can provide it, or if the fund must sell the assets it would otherwise prefer to hold.
View full-size figure
What a venture allocation must earn in the portfolio
Large managers can offer real advantages. Relationships with underlying funds, company information, transaction experience and capital across strategies may improve sourcing and execution. They may also allow a manager to choose between a primary commitment, direct investment and secondary purchase. Shared resources can be economically useful; they do not make the resulting funds interchangeable.
The next question is how that platform advantage reaches this vehicle. Advisors should examine the investments it receives, their prices, allocation policies among affiliated funds, meaningful company exposure, and the cost of delivery. Firm-wide assets are evidence of scale, not a return history for a newly launched fund. Similar company names across portfolios are a reason to investigate overlap, not proof that the venture mandate is merely marketing.
A return premium should matter after allocation
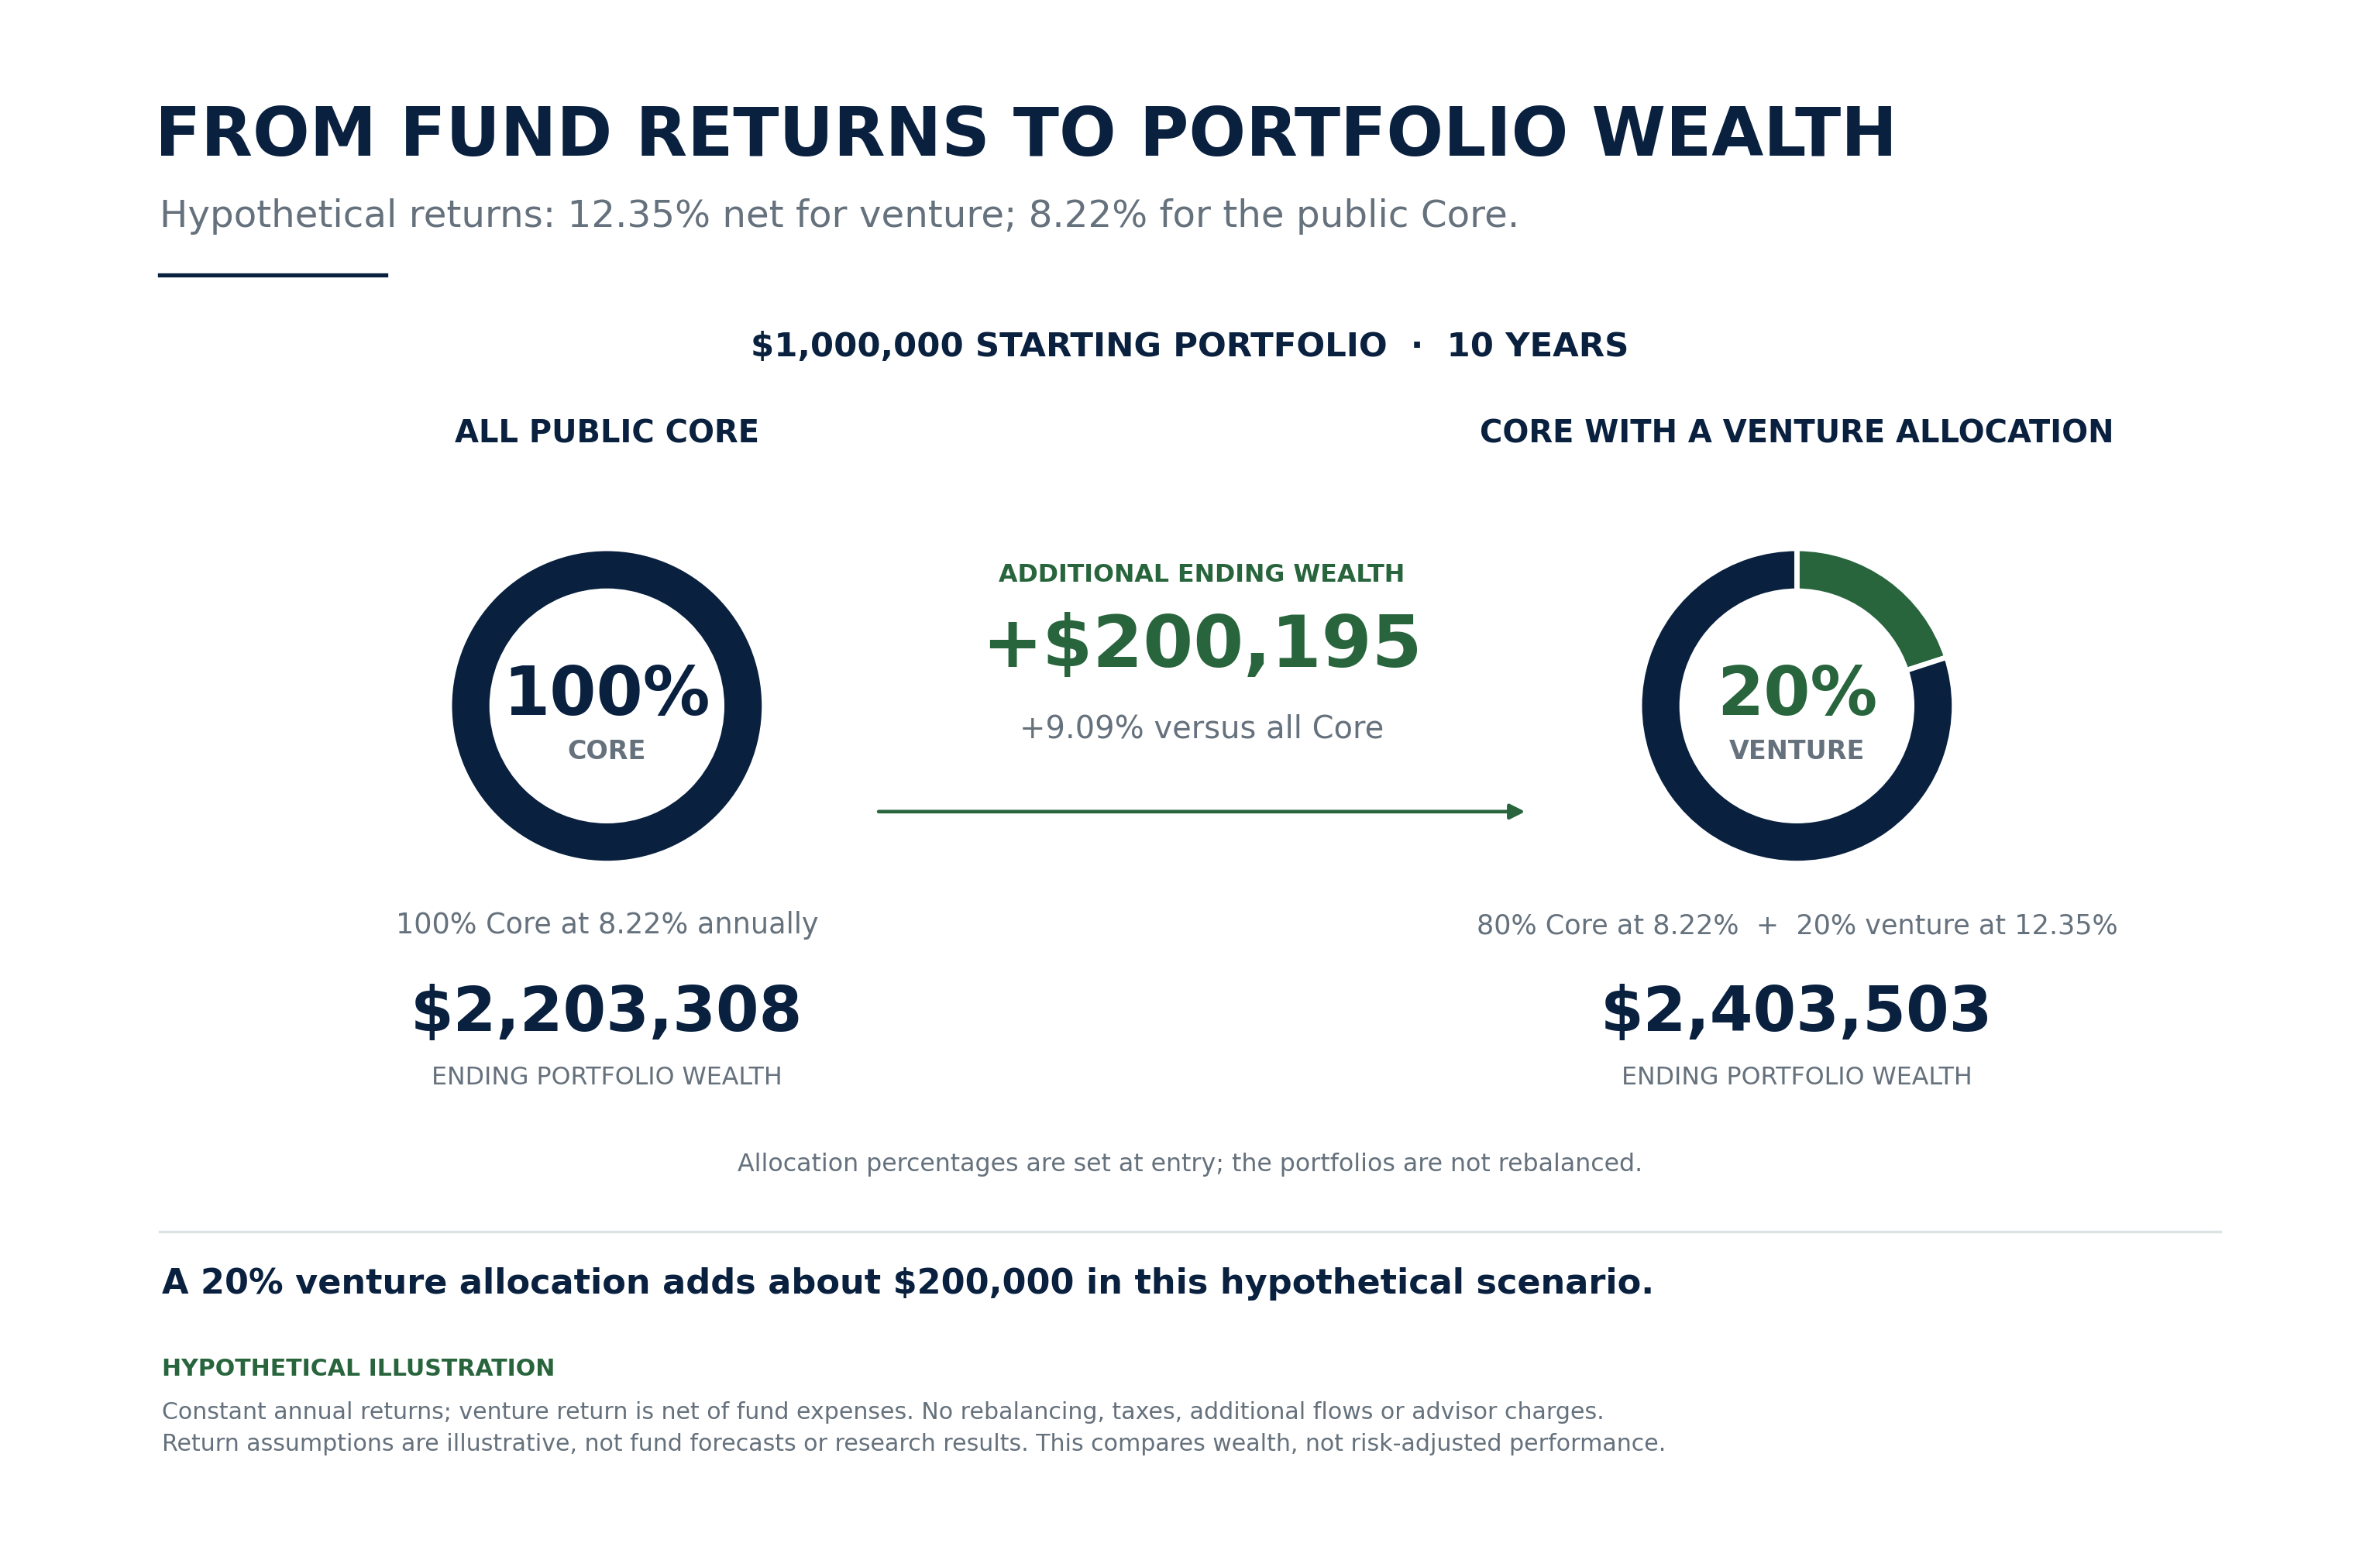
Consider a hypothetical $1 million portfolio with an initial 20% venture allocation. If the venture sleeve earns 12.35% net annually and the public Core earns 8.22%, the combined ten-year value is approximately $2,403,503, versus $2,203,308 for all Core: about $200,195 more, or 9.09% higher terminal wealth. This assumes constant returns, no rebalancing, no taxes, no additional flows and no additional advisor charges. The venture return is assumed net of fund-level costs. It is an illustration, not a forecast for any named fund.
The example shows how a substantial sleeve-level return premium can affect total portfolio wealth. It does not establish that a particular fund can earn that premium. The additional wealth must be weighed against the path of returns, cash restrictions and economic exposures. The 8.22% Core assumption is a comparison convention, not a guaranteed public-market outcome or a sufficient risk-adjusted benchmark by itself.
View full-size figure
The questions that decide the allocation
What advantage is being purchased? Identify a manager’s selection, access, entry-price or ownership advantage. Describe the future return mechanism without relying on a famous company or a private-market label.
How much of that advantage reaches the investor? Follow it through position sizes, dilution, fees, cash, realization timing and the price of entry. Compare the result with the actual alternatives for the capital.
Can the investor stay long enough to receive it? Test company funding needs, fund liquidity and client spending through adverse conditions. A venture sleeve can be appropriate within a conservative portfolio only when that portfolio can absorb its risks.
Our conclusion is conditional but consequential. Venture and growth funds can provide valuable exposure. The burden of proof is on the allocation to show what the client receives beyond access and how the fund preserves enough of the return opportunity to compensate for what the client gives up. That standard also gives each manager article a purpose: to examine the specific investment advantage, the evidence for it, and the conditions under which it may fail.
Alts Custodian connects private-investment research, portfolio modeling, and custody and administration to support advisors’ evaluation and implementation. The following appendix preserves the fund evidence behind this paper.
Appendix A. The researched fund universe
The observations below retain their reporting dates and definitions. They are not a same-date AUM comparison, a ranking, or a statement of statutory diversification. Firm history, vehicle history and class history are separate.
| Fund | Dated evidence | Why it matters to the thesis |
|---|---|---|
| StepStone SPRING | November 2022 operations; March 2026 NAV $6.489bn; 351 reported positions [1] | A substantial opening book and continuing purchases; positions are not unique companies. SPRING is distinct from STPEX. |
| Adams Street Venture & Growth | April 2026 prospectus: new fund, no operating history; target 60–80% secondaries [3] | Secondary route does not remove venture exposure; deployment targets are not observed holdings. AVNGR is distinct from AVGN. |
| ABS Pre-IPO and Growth | August 2026 factsheet: $180m assets; top ten 62.39%; Cerebras 20.72% [6] | Concentration can preserve meaningful upside and downside. IPOSX and IPOFX differ in shareholder costs. |
| Hamilton Lane VCG | Private operations September 2024; public registration May 2025; July 2026 IT allocation 75% excluding cash [8–9] | Multiple structures can share a sector risk; predecessor and registered returns are separate. |
| Partners Group Growth | September 2023 operations; March 2026 NAV $377.71m; directs $176.0m, secondaries $201.0m, primaries $2.9m [10] | Broad permitted exposures require classification by company stage and economics, beyond the transaction labels. |
| ARK Venture ARKVX | September 2022 operations; January 2026 NAV $557.59m; expected private range 20–90% under normal conditions [12–13] | A private/public innovation portfolio with a variable mix, not a fixed 80/20 mandate. |
| Fundrise Innovation VCX | Sponsor site confirms NYSE trading as of September 17, 2026 [15] | Listed access introduces an entry and exit price that can differ from NAV; equivalent modeling is not complete. |
Holdings and ownership
Keep company stage, transaction route, sector, vintage, legal vehicle, listed status and sale restrictions as separate fields. Several SPVs may represent one company. Overlap should include the client’s public equities, employer stock and other funds. Unknown holdings should remain unknown, rather than being treated as diversified.
Fundrise is retained as a structural comparator. The selected universe is the scope of this research program, not an exhaustive list of available funds or an investment recommendation.
Appendix B. Fees and the return that reaches the investor
| Fund | Documented cost feature | Consequence for analysis |
|---|---|---|
| SPRING | 1.50% management; 15% incentive economics [1] | Preserve the contractual fee bases, loss recovery and payment timing; do not duplicate underlying expenses. |
| Adams Street | 1.25% management; 12.5% incentive; separate waiver agreement [3–4] | Twelve-month management waiver starts six months after the actual Initial Closing Date, not every subscription. |
| ABS | 1.95% management; class costs and expense-limitation terms [5–7] | Reconcile exclusions, underlying expenses and recoupment; the advertised cap is not an unconditional all-in cost. |
| Hamilton Lane | 1.50% management; 15% quarterly incentive above loss recovery [8–9] | Unrealized gains may enter incentive profits. A fee-table illustration is not a fixed annual charge. |
| Partners Group | 1.50% management on the contractual greater base [10–11] | Unfunded commitments and eligible cash adjustments can change the effective fee relative to NAV. |
| ARKVX Class D | 2.90% disclosed net expense estimate; 3.49% gross [12] | Management is already included. Test waiver changes and applicable exclusions. |
Selected features are not comparable all-in expense ratios. Applicable offering documents, effective dates and class terms control. A complete Fundrise analysis also needs a dated market-price-to-NAV assessment.
Entry economics must be recognized once
An investor subscribing at NAV pays for appreciation already recorded. The model should not award the investor the original buyer’s discount again. Separate the existing holdings from future purchases, each with its own age, entry price, funding requirements and realization path.
When a holding is sold, remove it from invested NAV before recycling proceeds into a new position. Do not assume the opening portfolio stays unchanged for ten years. Returns already net of underlying fees and carry must not receive a second deduction for those same costs; gross company returns still need the full cost bridge.
Gains and cash require different evidence
SPRING’s March 2026 annual report identifies unrealized appreciation as the principal driver of the year’s investment return. ARK’s six months to January 2026 show approximately 98% of combined realized and unrealized investment gains as unrealized. These are dated observations, not evidence that the gains cannot ultimately be realized. They make valuation, monetization and fee timing central to the analysis. [1, 13]
Incentive fees can make two gross paths with the same terminal value produce different investor outcomes. Preserve accruals, payments and loss-recovery rules, and identify unknown opening balances. Consistent arithmetic does not validate the economic forecast.
Appendix C. Liquidity and investment diligence
| Vehicle | Investor access to cash |
|---|---|
| SPRING | Quarterly tenders subject to board approval and the specific offer terms. [1–2] |
| Adams Street | Intended quarterly offers up to 2.5%, subject to board discretion. [3] |
| Hamilton Lane VCG | Discretionary tenders; reviewed materials target no more than 3% of NAV quarterly. [9] |
| Partners Group Growth | Discretionary tenders; payment timing and any retained final balance matter. [11] |
| ABS and ARK | Interval-fund repurchases with limited capacity and potential proration. [5, 12] |
| Fundrise VCX | Exchange sale at market price, subject to trading conditions and applicable restrictions. [15] |
An offer for a percentage of fund shares does not guarantee that each investor can withdraw that same percentage of their account or redeem fully. Record notice deadlines, valuation dates, proration, early charges and settlement separately. A company financing, a valuation increase, an asset sale and a payment to the shareholder are distinct events.
What remains material in each research file
SPRING and Adams Street. Distinguish opening assets from future purchases and actual deployment from targets. The actual SPRING loss-recovery balance and Adams Street fee calendar remain material inputs. Publicly explained sourcing advantages do not independently validate their forward returns. [1, 3–4, 17]
ABS. Its April study of qualifying IPO completers informs successful-exit analysis, but cannot establish outcomes for all purchased companies. Retain delayed and failed IPO branches, impairment, dilution and post-listing losses. The August concentration weights require a consistent denominator before applying them to client exposure. [6, 16, 18]
Hamilton Lane. Reconcile audited reporting, regulatory holdings and sponsor series by date and definition. Differences require explanation; they do not establish misconduct. Preserve predecessor history separately and examine effective company and sector concentration. [8–9]
Partners Group. Classify the broader investment mix and commitments. Disclosed historical corrections require use of the right version. The June 26 registration amendment is preliminary; its existence does not establish an effective public offering. [10–11]
ARK and Fundrise. For ARK, distinguish private marks, public holdings, realization cash and tender funding; a recent tender funded from cash does not establish future capacity. For Fundrise, investor return includes changes in the premium or discount to NAV. [12–15]
Before implementation, confirm the actual share class, eligibility, minimum or waiver, intermediary availability, custody, charges and reporting. These operating facts are separate from the investment thesis.
Appendix D. Portfolio modeling and the limits of comparison
Use the same starting capital, horizon, public-market path, fee basis, cash-flow treatment and rebalancing convention when comparing investments. Add the wealth in the retained Core to wealth in the fund sleeve; do not average ten-year CAGRs to obtain an integrated return.
| Hypothetical fund return | Fund sleeve after ten years | Combined portfolio | Difference from all Core |
|---|---|---|---|
| 6.00% | $358,170 | $2,120,816 | −$82,492 |
| 8.22% | $440,662 | $2,203,308 | $0 |
| 9.00% | $473,473 | $2,236,119 | +$32,811 |
| 12.00% | $621,170 | $2,383,816 | +$180,508 |
| 12.35% | $640,856 | $2,403,503 | +$200,195 |
Illustration only: initial $1 million, 20% fund, 80% Core, 8.22% constant annual Core return, ten years, no rebalancing, taxes, additional flows or additional advisor charges. All-Core ending value is approximately $2,203,308. These examples illustrate allocation arithmetic and do not represent forecasts for the researched funds.
Each method answers a different question
Deterministic modeling shows the result under stated central assumptions. Composite entry paths examine different starting regimes. Monte Carlo examines a distribution conditional on return, risk and dependence assumptions. Structural resilience examines adverse operating and liquidity mechanisms. None establishes an expected return simply by passing calculation checks.
A higher central return can improve terminal wealth without reducing the immediate loss in a severe shock. Stress should combine public and private exposures, funding needs, valuation changes, exits and repurchases. Report the drawdown, recovery and cash shortfall, not only the eventual return. Smooth NAV histories are not sufficient calibration for economic downside.
Why the paper does not publish a performance ranking
Several recovered research records used an 8.00% Core; the active ARK reference uses 8.22%. Adams Street has later economic revisions beyond its early model. Hamilton Lane retains archived and candidate versions under economic review. Partners Group’s active forward-return fields remain unresolved. ARK’s central outcomes are sensitive to expenses and unconfirmed private-return assumptions. Fundrise does not yet have an equivalent completed research stack.
A cross-fund or venture-versus-secondaries ranking requires an aligned, supported comparison. Neither a retired model nor a return assumption chosen to beat Core should be presented as the evidence that resolves the investment case.
A portfolio may value an exposure for reasons beyond maximizing expected wealth. Those reasons should be stated and tested. If return enhancement is the objective, failing to establish it is a finding the advisor should retain.
Sources and interpretation
Research date: September 17, 2026. Dated fund observations remain tied to their original reporting periods. Filings govern contractual terms; sponsor publications and interviews provide manager perspectives. Refresh terms before publication or implementation. Numbered citations identify the supporting source, not a manager endorsement.
[1] StepStone SPRING annual report Year ended March 31, 2026. Operations, scale, valuation, expenses and liquidity.
[2] StepStone SPRING tender filing July 24, 2026. Fund repurchase process; read with the applicable offer.
[3] Adams Street Venture and Growth prospectus April 6, 2026. Strategy ranges, share classes, fees and discretionary tenders.
[4] Adams Street management fee waiver agreement January 27, 2026. Contractual waiver timing relative to the Initial Closing Date.
[5] ABS Pre IPO and Growth prospectus July 29, 2026 edition reviewed in the underlying research. Class and expense terms.
[6] ABS fund factsheet August 31, 2026. Dated holdings, concentration, scale and sponsor expense presentation.
[7] ABS fund annual report as amended March 31, 2026 reporting period. Accounting and expense disclosures.
[8] Hamilton Lane Venture Capital and Growth annual report Year ended March 31, 2026. Fund history, valuation and incentive mechanics.
[9] Hamilton Lane US fund resources US vehicle and current document access. July factsheet and August prospectus informed the research.
[10] Partners Group Growth annual report Year ended March 31, 2026. Investment mix, corrected history, commitments and fees.
[11] Partners Group Growth registration amendment June 26, 2026 preliminary offering document. Draft terms are not evidence of an effective public offering.
[12] ARK Venture prospectus and supplements Prospectus October 28, 2025; latest included supplement January 23, 2026. The filename is not its date.
Sources and interpretation continued
[13] ARK Venture semiannual financial statements Six months ended January 31, 2026. NAV bridge, investment gains, valuations and borrowing.
[14] ARK Venture first quarter update Manager commentary on flows, portfolio and tender funding; not independent underwriting.
[15] Fundrise venture fund access Accessed September 17, 2026. Confirms exchange trading under VCX and market-price risk.
[16] ABS late stage private venture research April 9, 2026. Selected IPO-completer sample; its selection limits are discussed in this paper.
[17] StepStone manager interview on SPRING January 10, 2025. Published interview summary; manager perspective on secondary-led access.
[18] ABS manager interview on growth equity April 6, 2026. Published interview summary; qualitative strategy and access context.
[19] NVCA 2026 Yearbook 2025 observations. Printed pages 6, 20 and 69 inform concentration and the time to IPO; these are market data, not fund return forecasts.
[20] NVCA explanation of venture capital Institutional funding, company development and the role of the venture manager. Historical market-cap examples on this page are not used.
[21] Kauffman Foundation venture investment study May 2012, executive summary. A historical study of the foundation’s own portfolio, not a current industry census.
[22] Harris Jenkinson Kaplan and Stucke on performance persistence November 2020 working paper, information through June 2019. Evidence on VC manager persistence, with fund families and styles distinguished.
[23] Pastor Stambaugh and Taylor on opening private markets August 31, 2026 working paper summary. A theoretical equilibrium result, not empirical validation of these seven vehicles.
How to read the argument
The economic mechanisms, hypothetical examples and allocation criteria are Alts Custodian’s analysis. Industry studies concern their stated samples and periods. They do not establish a current success rate for all venture managers or prove the performance of the researched wealth vehicles. The equilibrium paper is theoretical. The research does not assert that diversification inherently reduces expected returns or that secondaries universally outperform venture.
Investment and model limitations
This material is educational research, not a personalized recommendation or an offer to buy or sell a security. Private investments can lose value and restrict access to capital. Historical returns, target allocations and modeled outcomes do not guarantee future results. Diversification does not eliminate loss. Applicable offering documents and investor-specific conditions govern any investment.
No manager endorsement is implied. Qualitative portfolio breadth does not change statutory diversification status. Manager-scale figures and historical returns are not forecasts for a new fund or share class.